Introduction
Some people drop out of becoming buyers after a product demo, while others become buyers after just one visit to a blog. It's that journey they have traveled towards the point of accessing it. This makes customer journey analytics very important: to help you track every touchpoint, interaction, and micro-moment across the buyer journey; to turn chaos into clarity. In organizations where decisions are very rarely made in a single session, such as SaaS companies, understanding the entire journey is the key to unlocking ongoing growth.
Fundamentally, customer journey analytics are connecting user behavior, marketing analytics, and the whole customer experience. It enables you to move beyond vanity metrics and understand the whys behind every click, scroll, bounce, and conversion. If done right, it surfaces customer insights to drive smarter campaigns, better onboarding flows, and the most personalized product experiences—all grounded in real, observable actions. You can't rely on assumptions in a fast, cut-throat environment where attention is fleeting. Whether pursuing trial-to-paid conversion increases, churn reduction, or merely figuring out the experiences that matter, journey analytics serves as the map and magnifying glass. This blog will take you through all that you need to know: from mapping your SaaS buyer journey and setting up tracking to visualizing data and acting on the insights that matter most. If you're serious about turning data analytics into real growth, this is your starting line.
What is Customer Journey Analytics?
Customer journey analytics is essentially tracking, analyzing, and interpreting a customer's interaction with your business throughout every touchpoint overshadowed with respect to time. While campaign-based or page view-based analytics remain isolated from each other, customer journey analytics relates the entire sequence of user actions starting from the first advertising impression, with necessary engagements after the sale. When collated from different data sources, the customer journey analytics ensure a coherent understanding of the buyer journey that impacts conversions, experiences, slips, and value-generating interactions.
With the continual evolution of customer journey analytics metrics, marketers and product teams are now able to go beyond superficial statistics to understand real user behavior within a holistic view. It is not simply letting us know what our users did, but also why, when, and what happened next. The ability to move from this static view to dynamic path analysis is imperative for providing personalized, consistent, and high-converting customer experiences.
Why it is Especially Important for SaaS Businesses
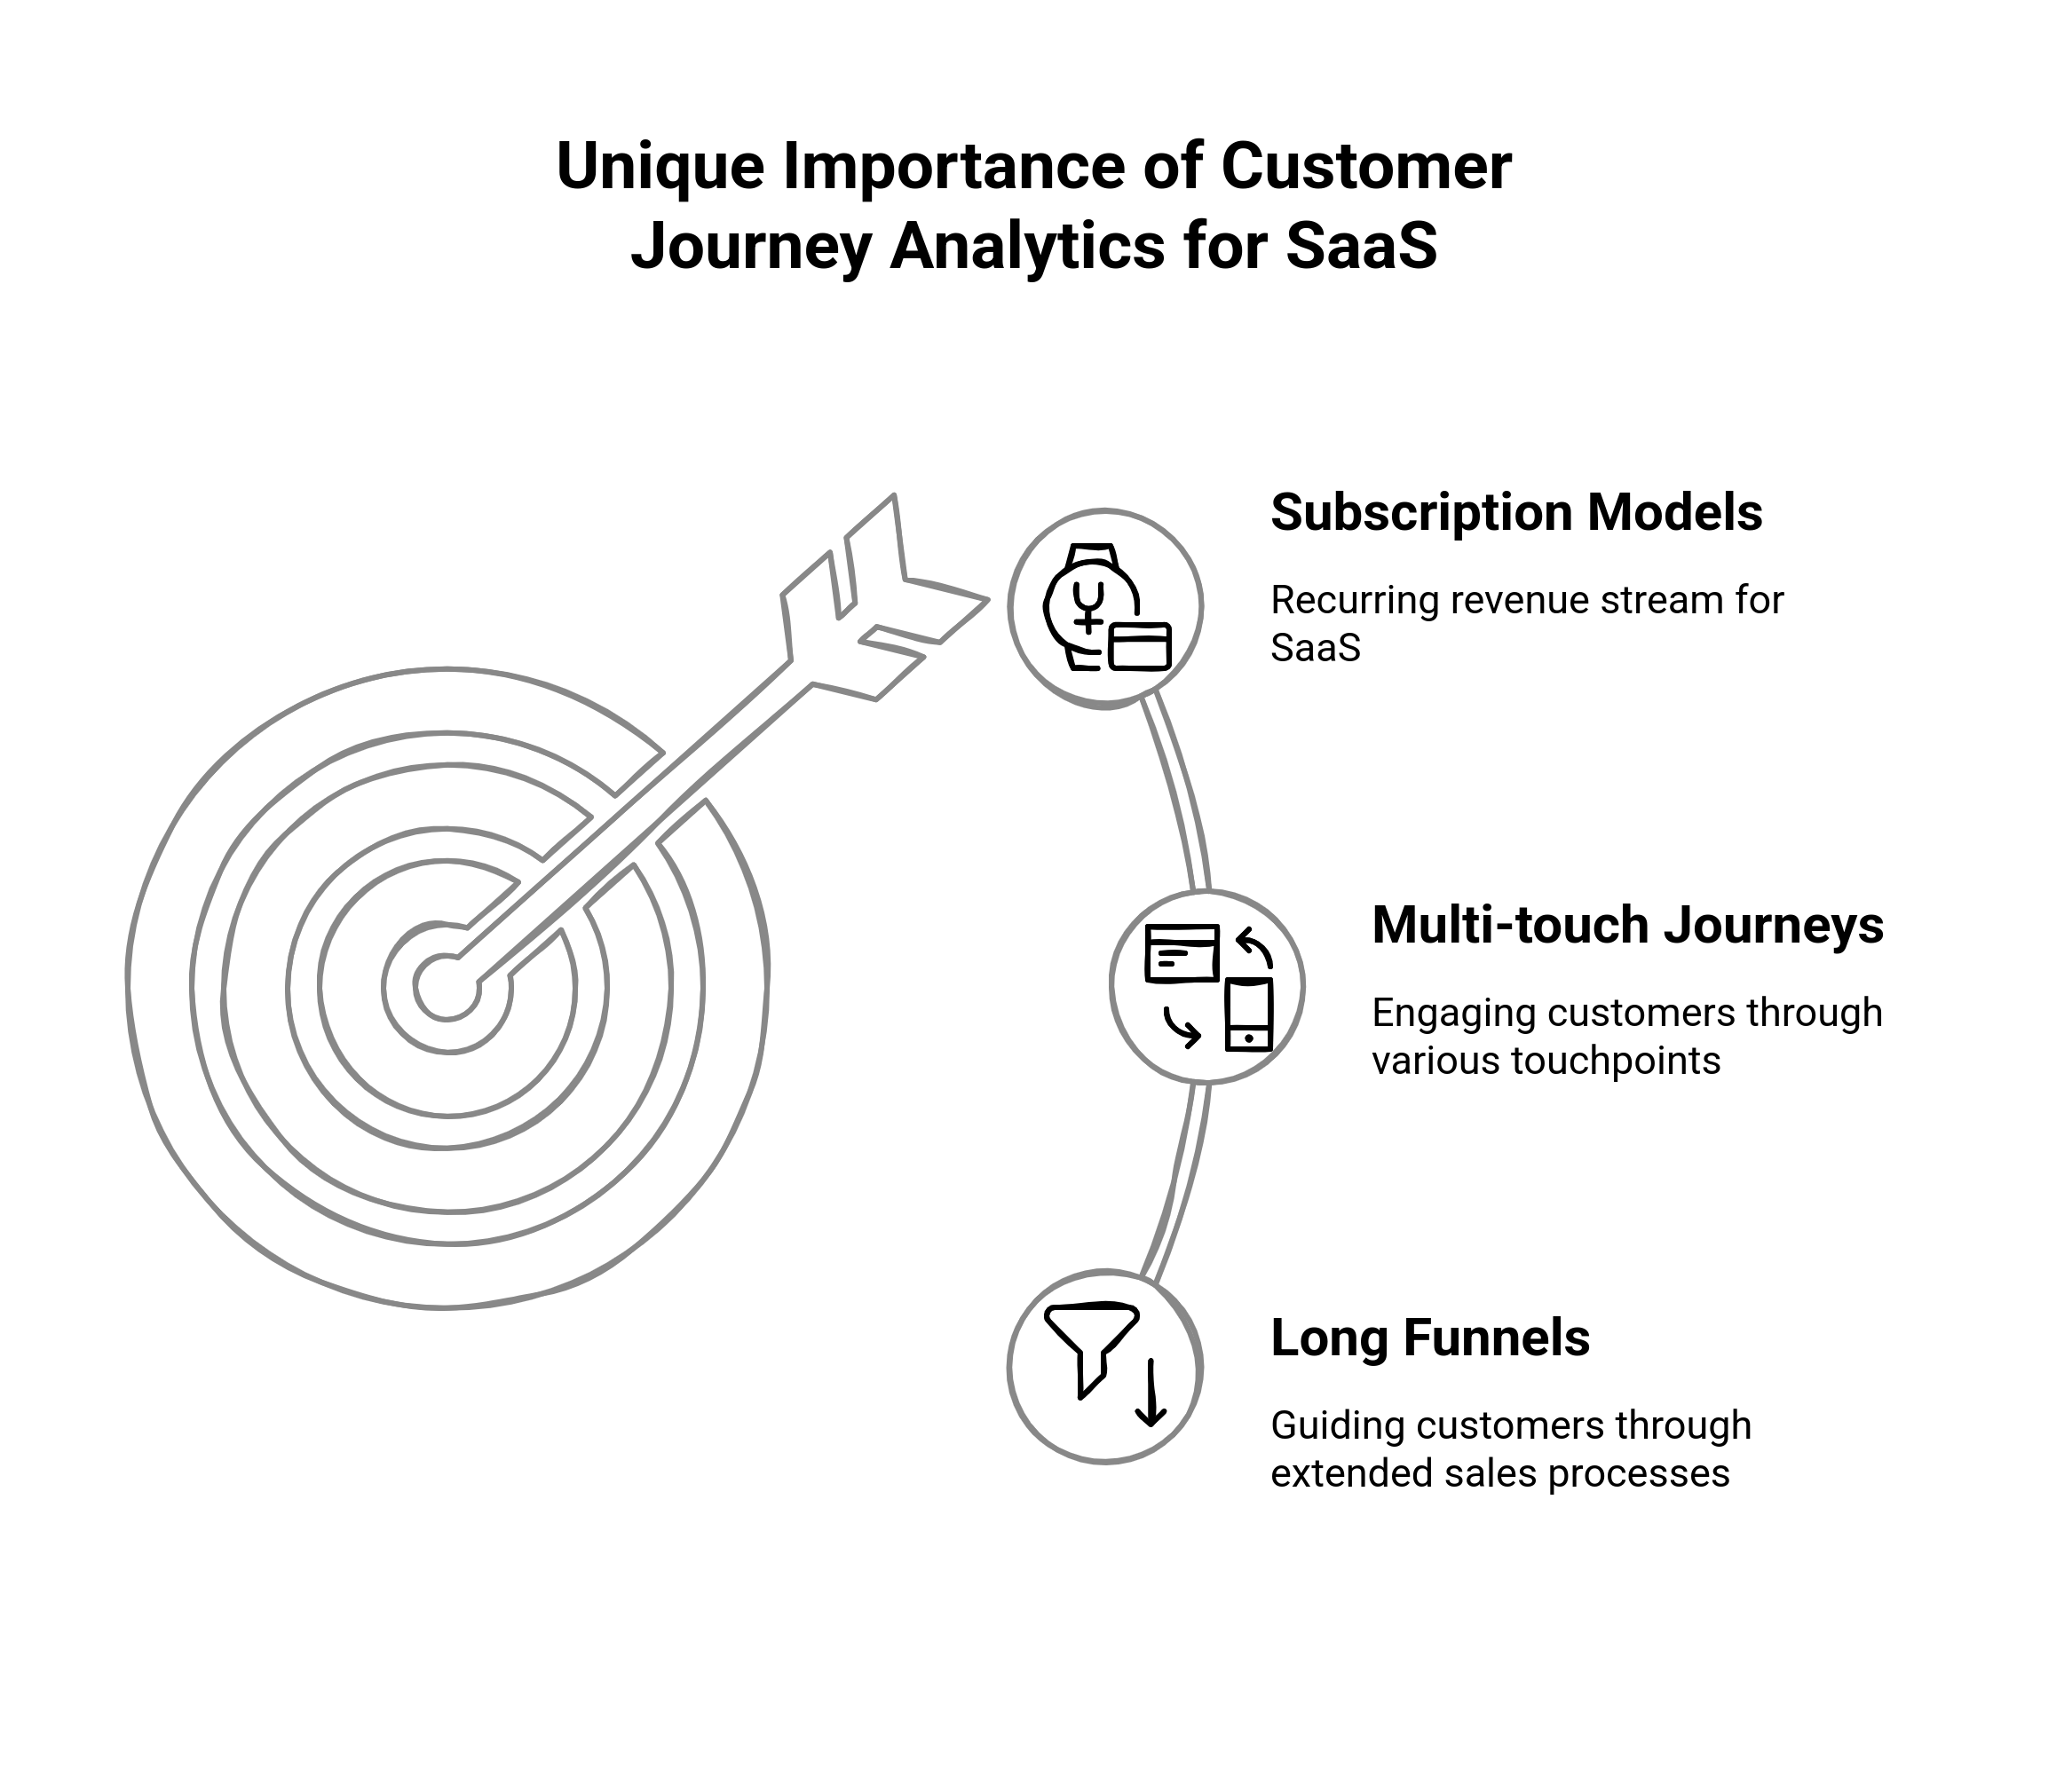
For SaaS companies, customer journey analytics is not optional: it is fundamental. The regular journey for a SaaS buyer is lengthy, winding, and populated with friction points. Prospects may read a blog, join a webinar, perform a free trial, interact with sales, and check the product, all before making a decision. After conversion, the journey continues through onboarding, activation, renewal, and expansion. These are not one-off transactions; rather, they are evolving relationships built on recurring value.
On subscription models, success is based not just on making an acquisition but also ensuring retention and lifetime value. Therefore, knowing how users behave along all steps of the journey is critical. You want to know which actions relate to retention, which onboarding steps lead to activation, and which marketing touchpoints actually move the needle. That is the kind of insight that will come from customer journey analytics.
Drawbacks of Traditional Funnel Tracking
Most of the conventional analytics tools assume static and linear funnels, whereby the users are assumed to move from Point A to Point B to Point C. But this is a far cry from the truth in the real world, especially so in Saas. The bounce between channels, revisiting features, and most importantly, interacting unpredictably with your brand is the trait that defines SaaS users. Funnel might tell you 30% of users are dropping off after signup, but it won’t tell you why or any actions preceded that drop-off.
Marketing Analytics and campaign dashboards in isolation cannot provide all the answers. They tend to provide performance in isolation, not context. To understand and optimize customer experience further on, SaaS teams should view the journey as it unfolds across devices, over weeks or months, and through every product, content, and interaction with support. That's data analytics through a journey mindset, and it's this very culture that separates reactive teams from high-growth ones.
Key Stages of a SaaS Customer Journey You Must Track
In SaaS, the buyer journey is rarely linear and rarely short. It unfolds over multiple channels, touchpoints, and moments of value. Understanding user conversion is only a prerequisite to leverage a customer journey analysis in later stages concerned with how a user becomes a loyal customer or drops out before the realization of value. Below are the seven critical stages that every SaaS team should track and optimize for using a combination of user behavior, marketing analytics, and product engagement data.
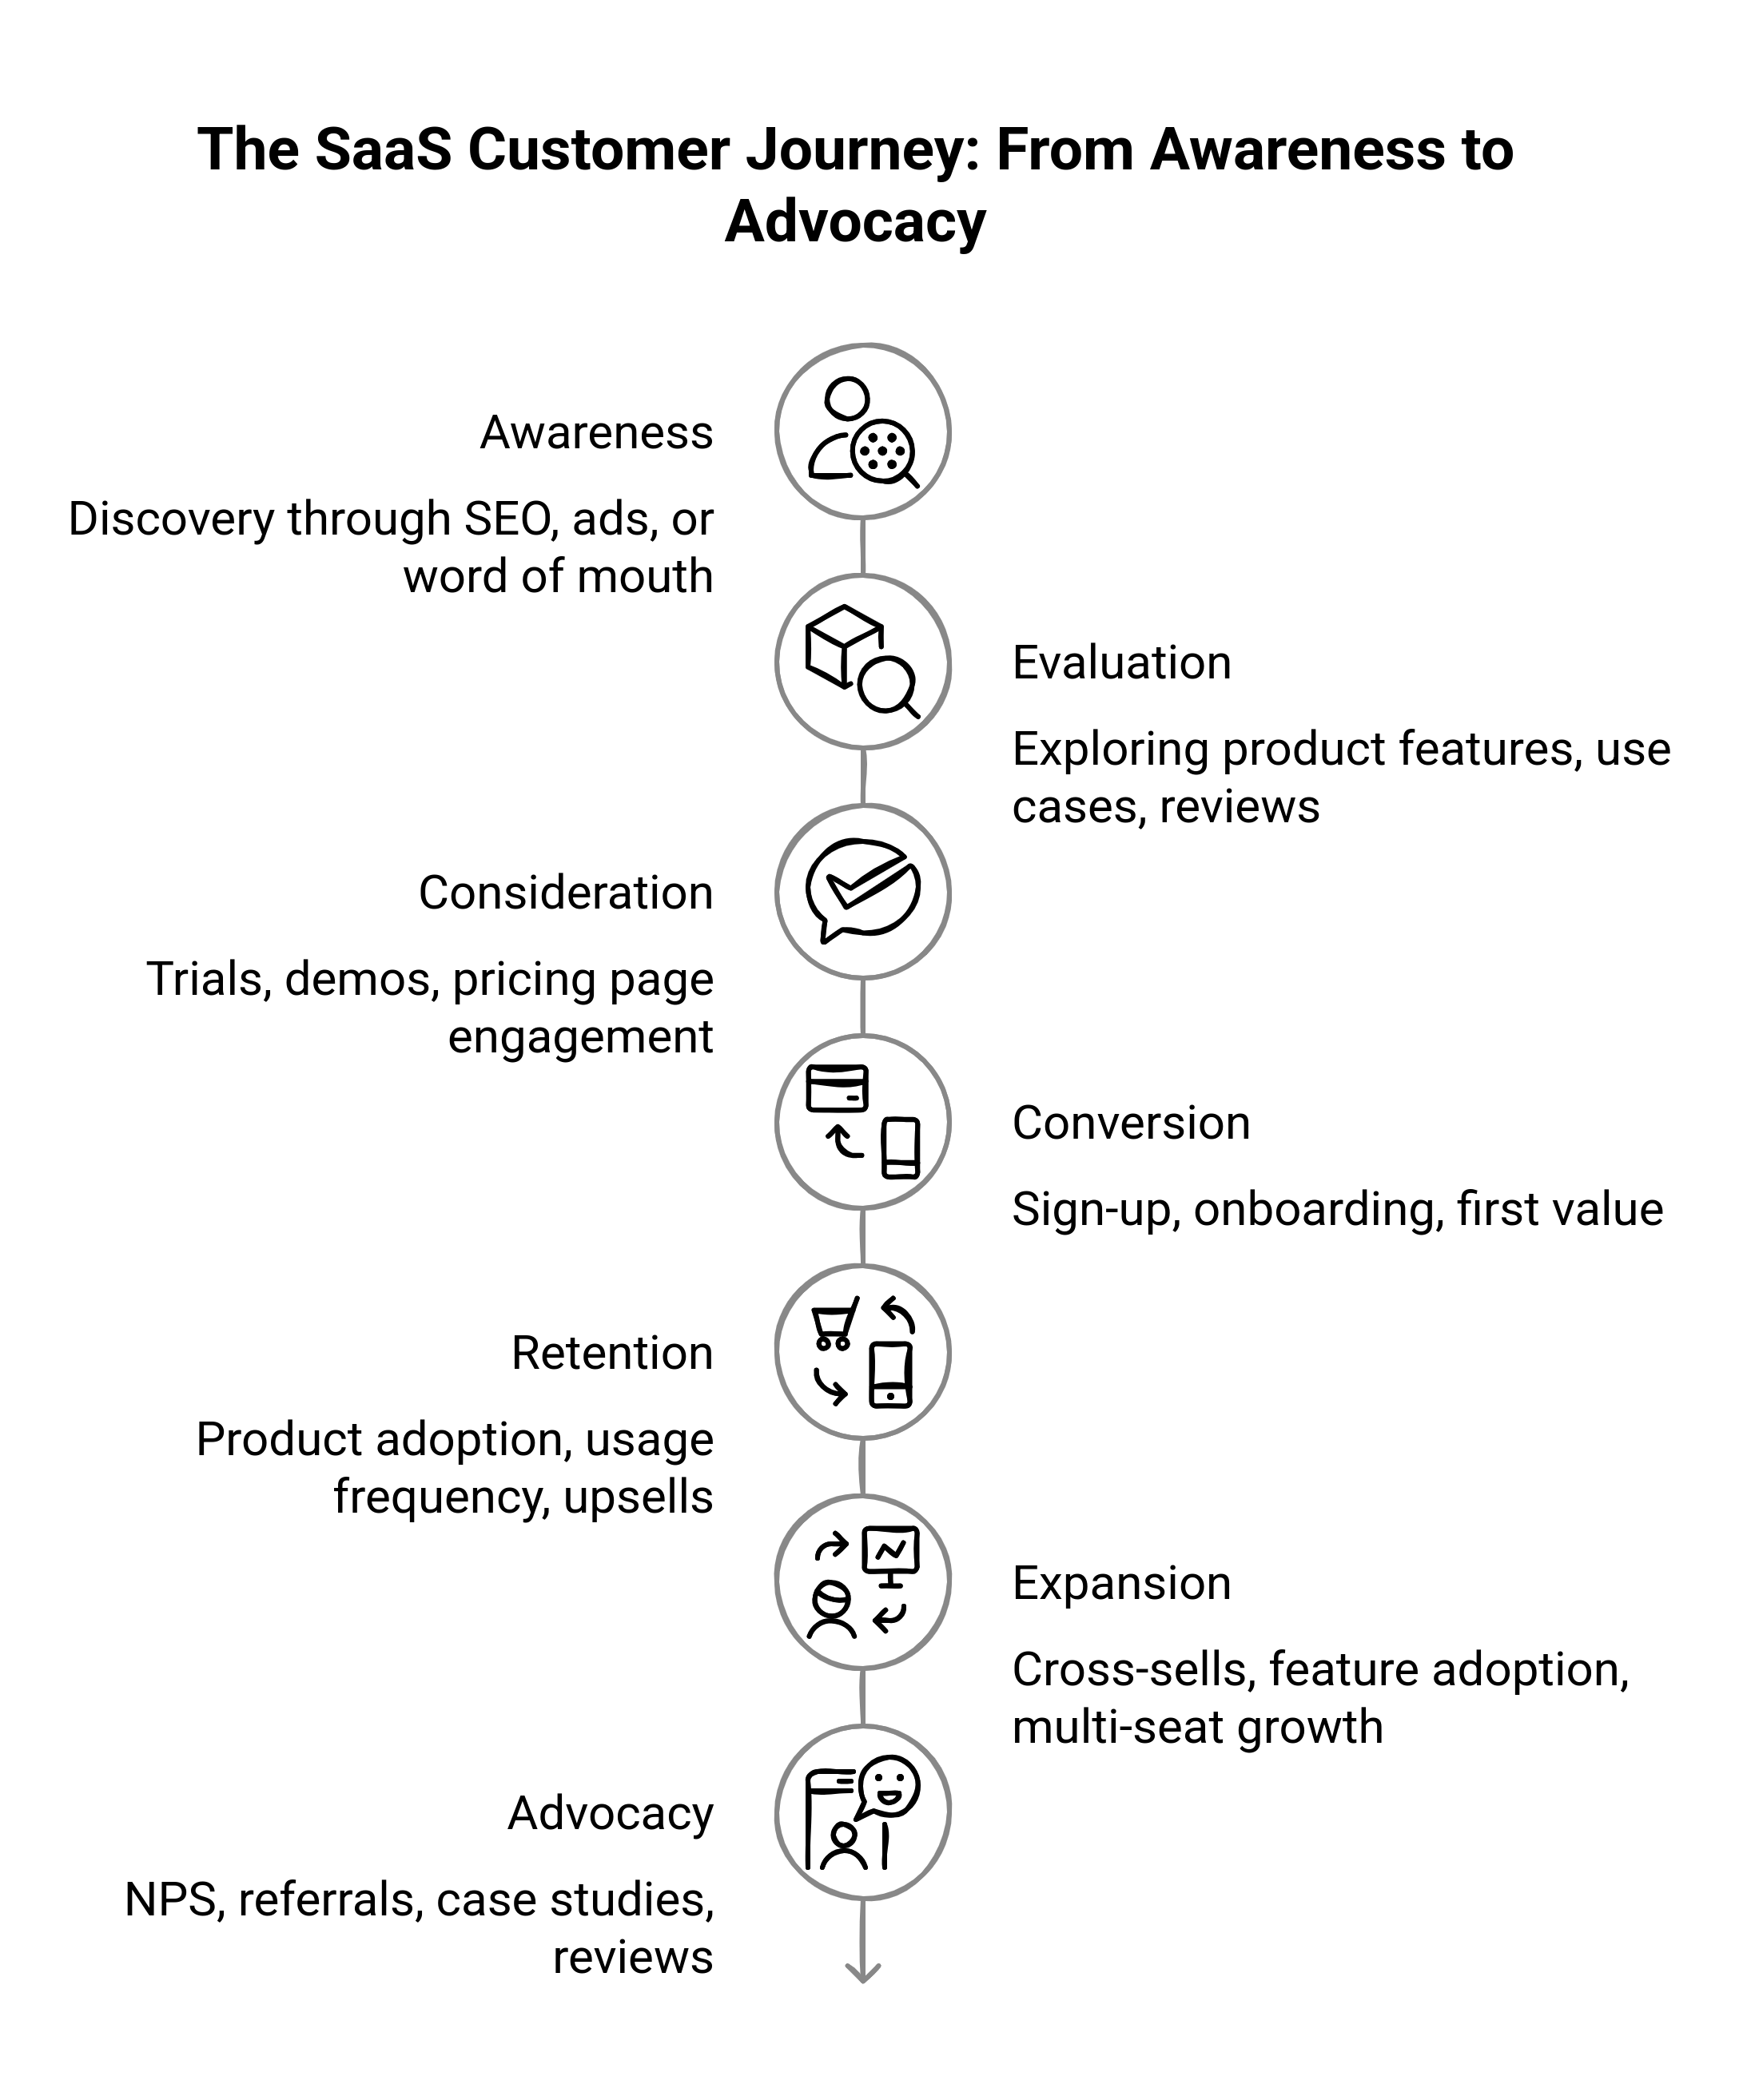
Awareness: Discovery Through SEO, Ads, or Word of Mouth
This is the point at which the journey starts. That is to say, when a potential customer has his or her first encounter with the brand. This could happen through an SEO-optimized blog post, a paid search ad, a social media mention, or a referral. Track impressions and a click-through rate, content engagement, as well as possible sources of traffic, to get a clear idea of what's driving visibility and top-of-funnel traffic. It's not about conversion: it's about attention here.
Evaluation: Searching for Features of the Product, Use Cases, and Reviews
Once aware, prospects begin to dig deeper. They visit your website, explore product pages, scan use cases, watch demos, and look for outside validation in reviews like G2 or testimonials from other customers. Here, customer insights become paramount—you want to know which content or features resonate with different personas. Behavior here often signals the intent to buy, tracking feature exploration, video views, and documentation usage might reveal high-quality leads.
Consideration: Trials, Demos, and Engagement on Pricing Page
Now the buyer is leaning in. They are assessing how your solution fits their needs. They might register for a free trial, schedule a demonstration, or intensely scrutinize your pricing page. These are high-value touchpoints. Trial activation steps, demo attendance, and pricing page bounce rates should indicate where interests deepen or break off. This is also often where sales and marketing alignment becomes paramount.
Conversion: Sign-Up, Onboarding, and First Value
The actual conversion in SaaS goes beyond sign-up. A proper conversion occurs at the moment the user reaches their initial valuable experience with the product. This moment can include sending their first campaign or integrating our product into their stack, or even completing onboarding. This is where customer journey analytics is useful: It highlights friction points in onboarding flows, provides insight into drop-off patterns, and lends itself to optimizing for activation and not just acquisition.
Retention: Product Adoption, Usage Frequency, and Upsells
This is the moment when the customer is using the product, and the main concern is to provide regular value. At this step, only important features are mentioned: product usage frequency and depth, logins, and readiness for renewal. Using data analytics from your product and combining it with usage-triggered communications can help overcome churn and improve net revenue retention. Retention is not a destination; it is an ever-engaged and satisfied user.
Expansion: Cross-Sells, Feature Adoption, and Multi-Seat Growth
Happy customers often have untapped potential. As users see more value, they might add more team members, adopt new features, or move to a higher-tier plan. Tracking signals like increased usage, in-app behavior, and support ticket themes can uncover expansion opportunities. This is where your marketing analytics and product data must work together to proactively identify growth signals before a user even reaches out.
Advocacy: NPS, Referrals, Case Studies, and Reviews
The last stage is a multiplier and not an end. Loyal customers become advocates the moment they start referring others or give glowing reviews and product success stories, that is when journey analytics will come in handy to help you connect behaviors like high feature engagement, support satisfaction, or renewal with behaviors of advocacy. Closing the loop transforms customer experiences into brand equity and organic growth.
Understanding the Building Blocks of Customer Journey
Before you can analyze or improve the buyer journey, you need to understand what it's actually made of. Imagine the customer journey as a living, breathing timeline, composed of granular actions, really meaningful attributes, and rich-context interactions that unfold over time and across channels. This section unpacks the underlying building blocks of customer journey analytics so teams can analyze user behavior meaningfully.
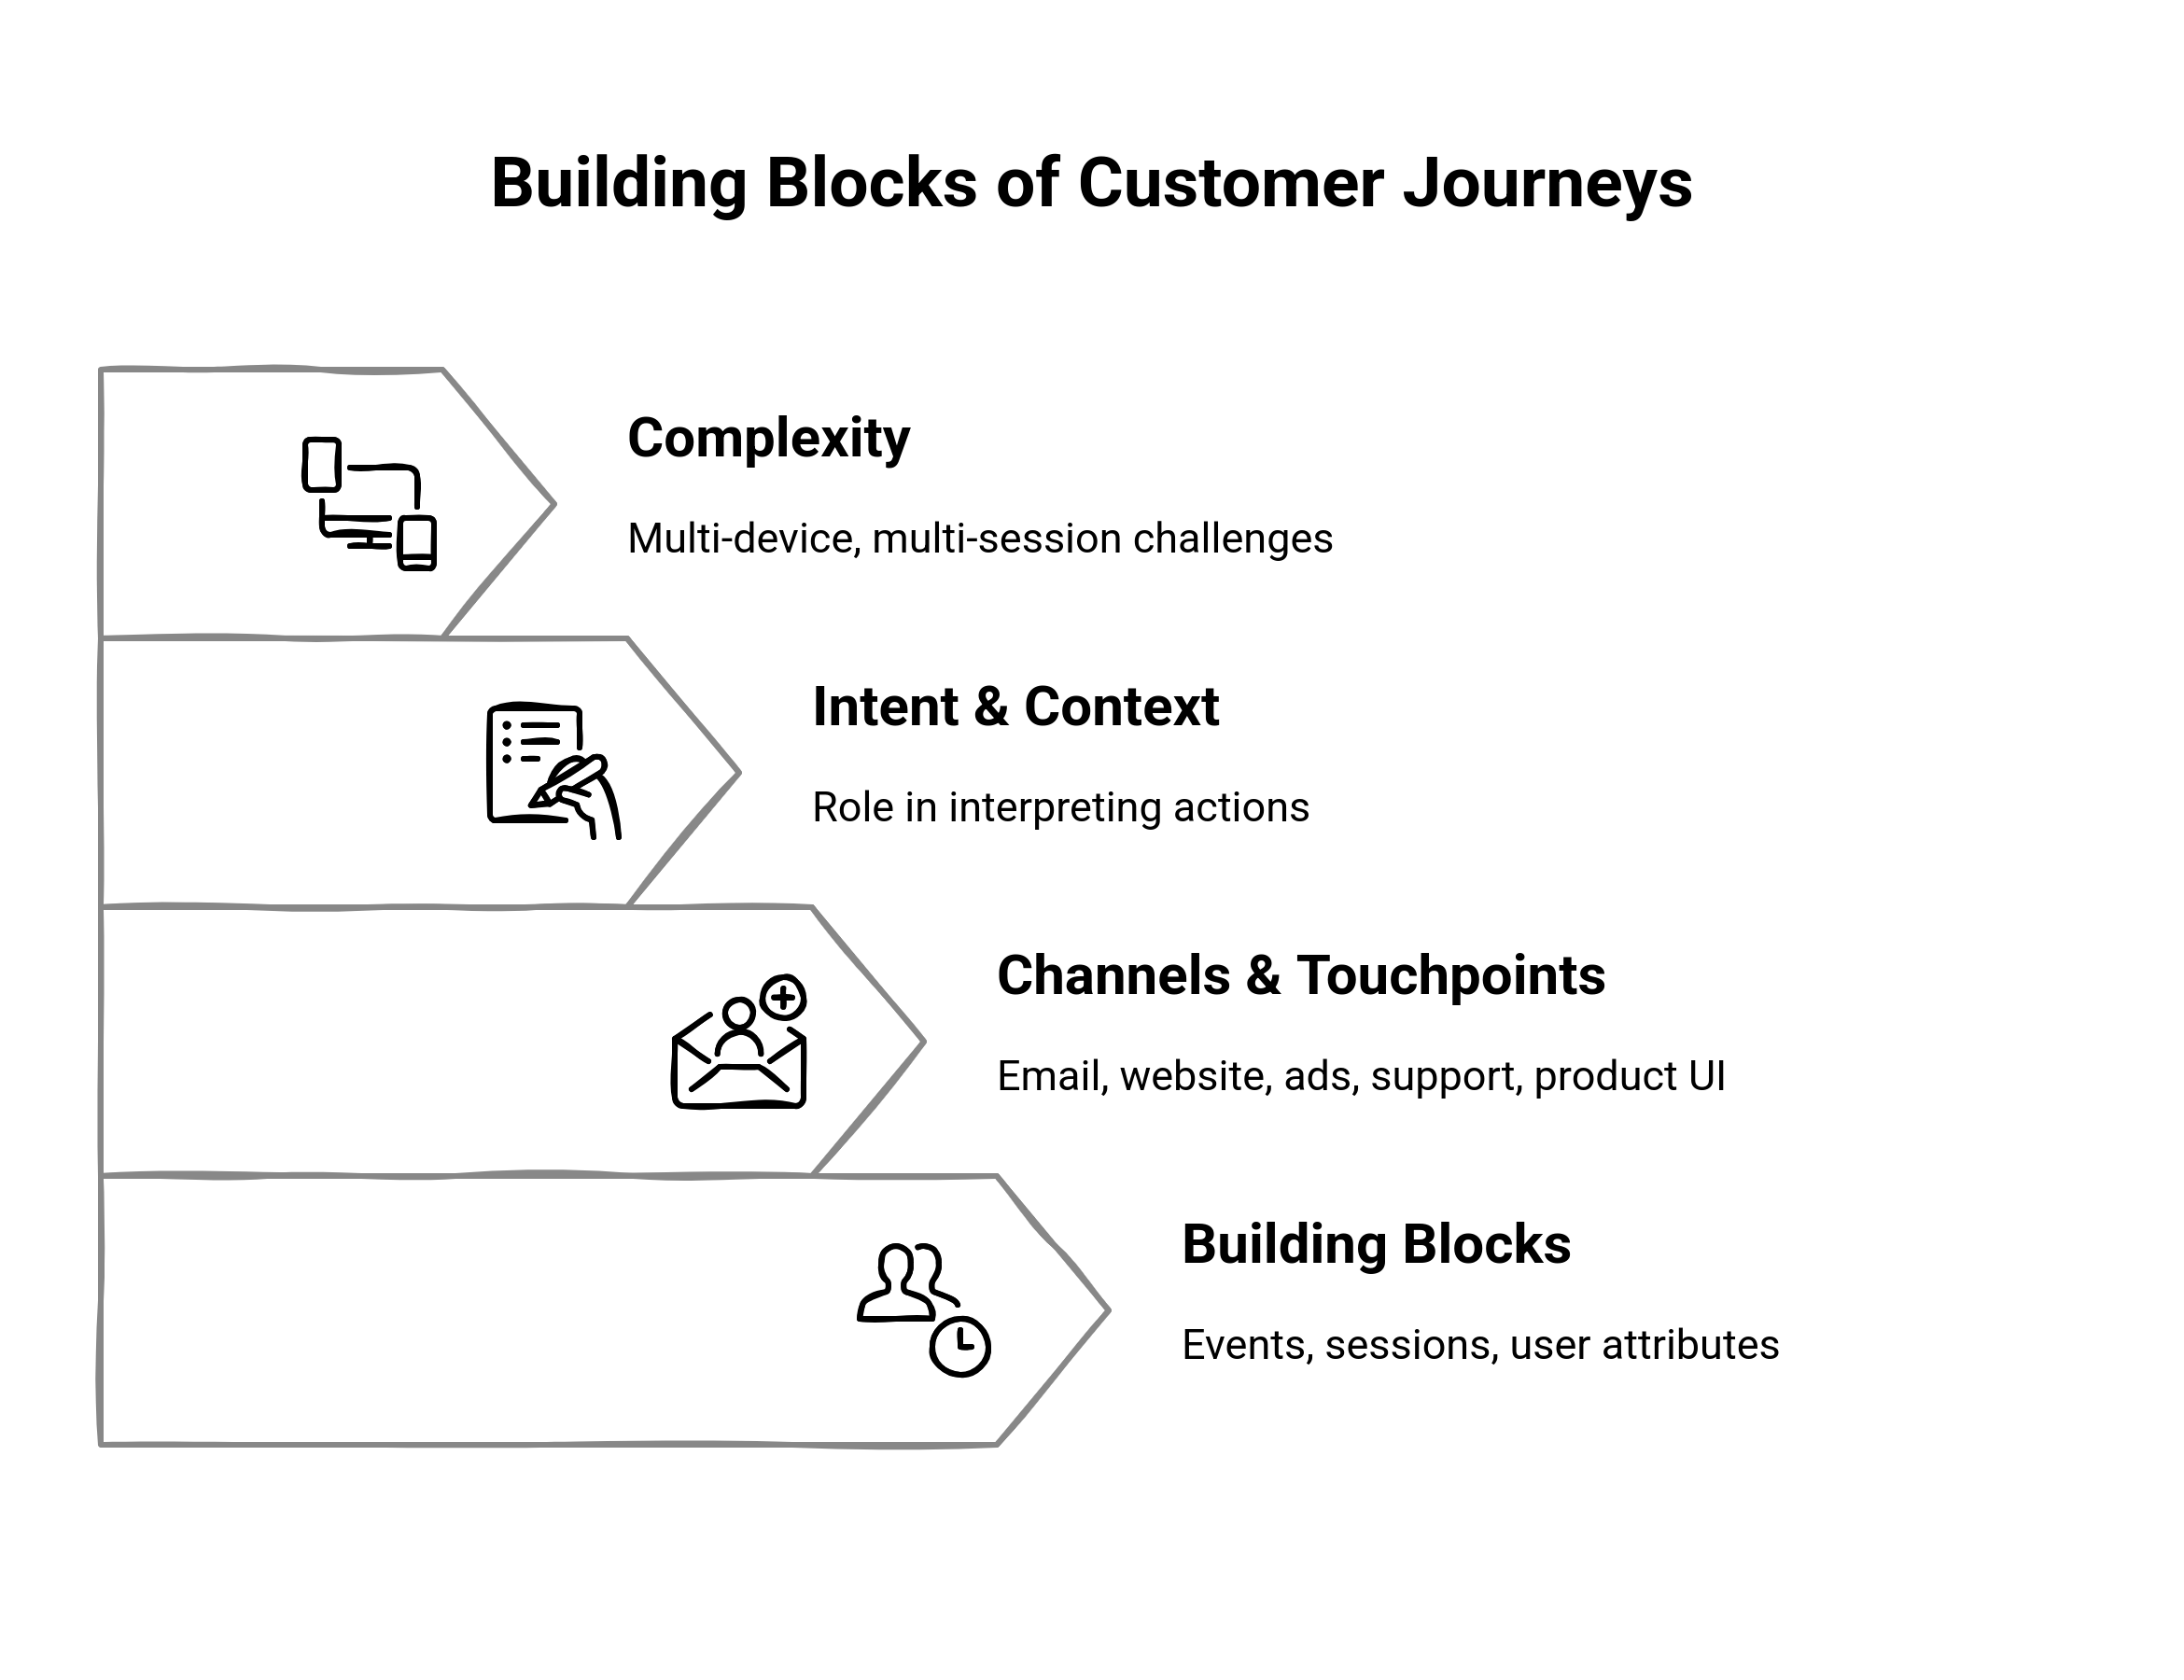
Events, Sessions, and User Attributes: How Journeys are Built
At the core of any customer journey analysis setup are events—the individual actions a user takes. These actions could take anything from page views, button clicks, video plays, and feature activations to more advanced signals like form submissions or product milestones-e.g., "Created first dashboard." Events are the atoms of behavioral tracking.
All these events are united under what one calls a session, the uninterrupted flow of activity concerning some timeframe. Sessions allow us to investigate how users behave in one sitting and how they behave over time. For example, two users might sign up, but one finishes onboarding in a single session while the second does it over several days-important according to activation analysis.
Now comes the user attributes. User attributes are permanent data points that deepen your insight about who the user is. These include such data as role, company size, industry, lifecycle stage, or even subscription plan. Combine user attributes with behavioural events, and you can tell how differently those cohorts pass through the journey and respond to those different experiences.
Channels and Touchpoints: Email, Website, Ads, Support, Product UI
These days, SaaS journeys never happen in isolation. Customers engage with the brand at various channels and touchpoints, each playing its own role in shaping perceptions and actions. Each of them includes:
Web: blog content, entry pages, pricing pages, signup flows.
Email: onboarding sequences, product nudges, lifecycle campaigns.
Digital Ads: display retargeting, social ads, search marketing.
Product UI: tooltips, modals, in-app guides, and usage patterns.
Support: help docs, chatbots, support tickets, and CS touchpoints
Monitoring these touchpoints goes a long way in understanding how they affect the journey in terms of advancement or dropout. For instance, a user can get initial exposure from an advertisement, proceed to reading a comparative blog post, sign up, receive an onboarding email, and then ask a question for support; all of this happens even before upgrading. If you don't connect these snippets, then you only have part of the story.
Cross-Device, Cross-Session Complexity
Modern user behavior doesn't follow any clear lines. A buyer will discover a product first through mobile, then explore the features on the desktop later that week. Finally, it is converted after attending a webinar on a work laptop. If this analytics setup doesn't resolve identity across devices and sessions, you will have fragmented views that miss the bigger picture. This complexity underscores why identity resolution is critical. Tools that stitch behavior together across sessions (login events, cookies, or user IDs) allow you to view the journey as a continuous narrative rather than scattered moments. Without it, key signals, such as return visits or cross-channel influence, remain invisible, leaving your analysis shallow and your optimizations misguided.
How Customer Journey Analytics Really Works
To get beyond just sticking the tool in the ground and hoping to get some insights, you really have to understand the operation of customer journey analytics. Underneath that neat dashboard of journey visualization lies a very complicated web of data collection, identity resolution, event sequencing, and then analysis layers, all meshing so that you can really discern an actionable view of the buyer journey.
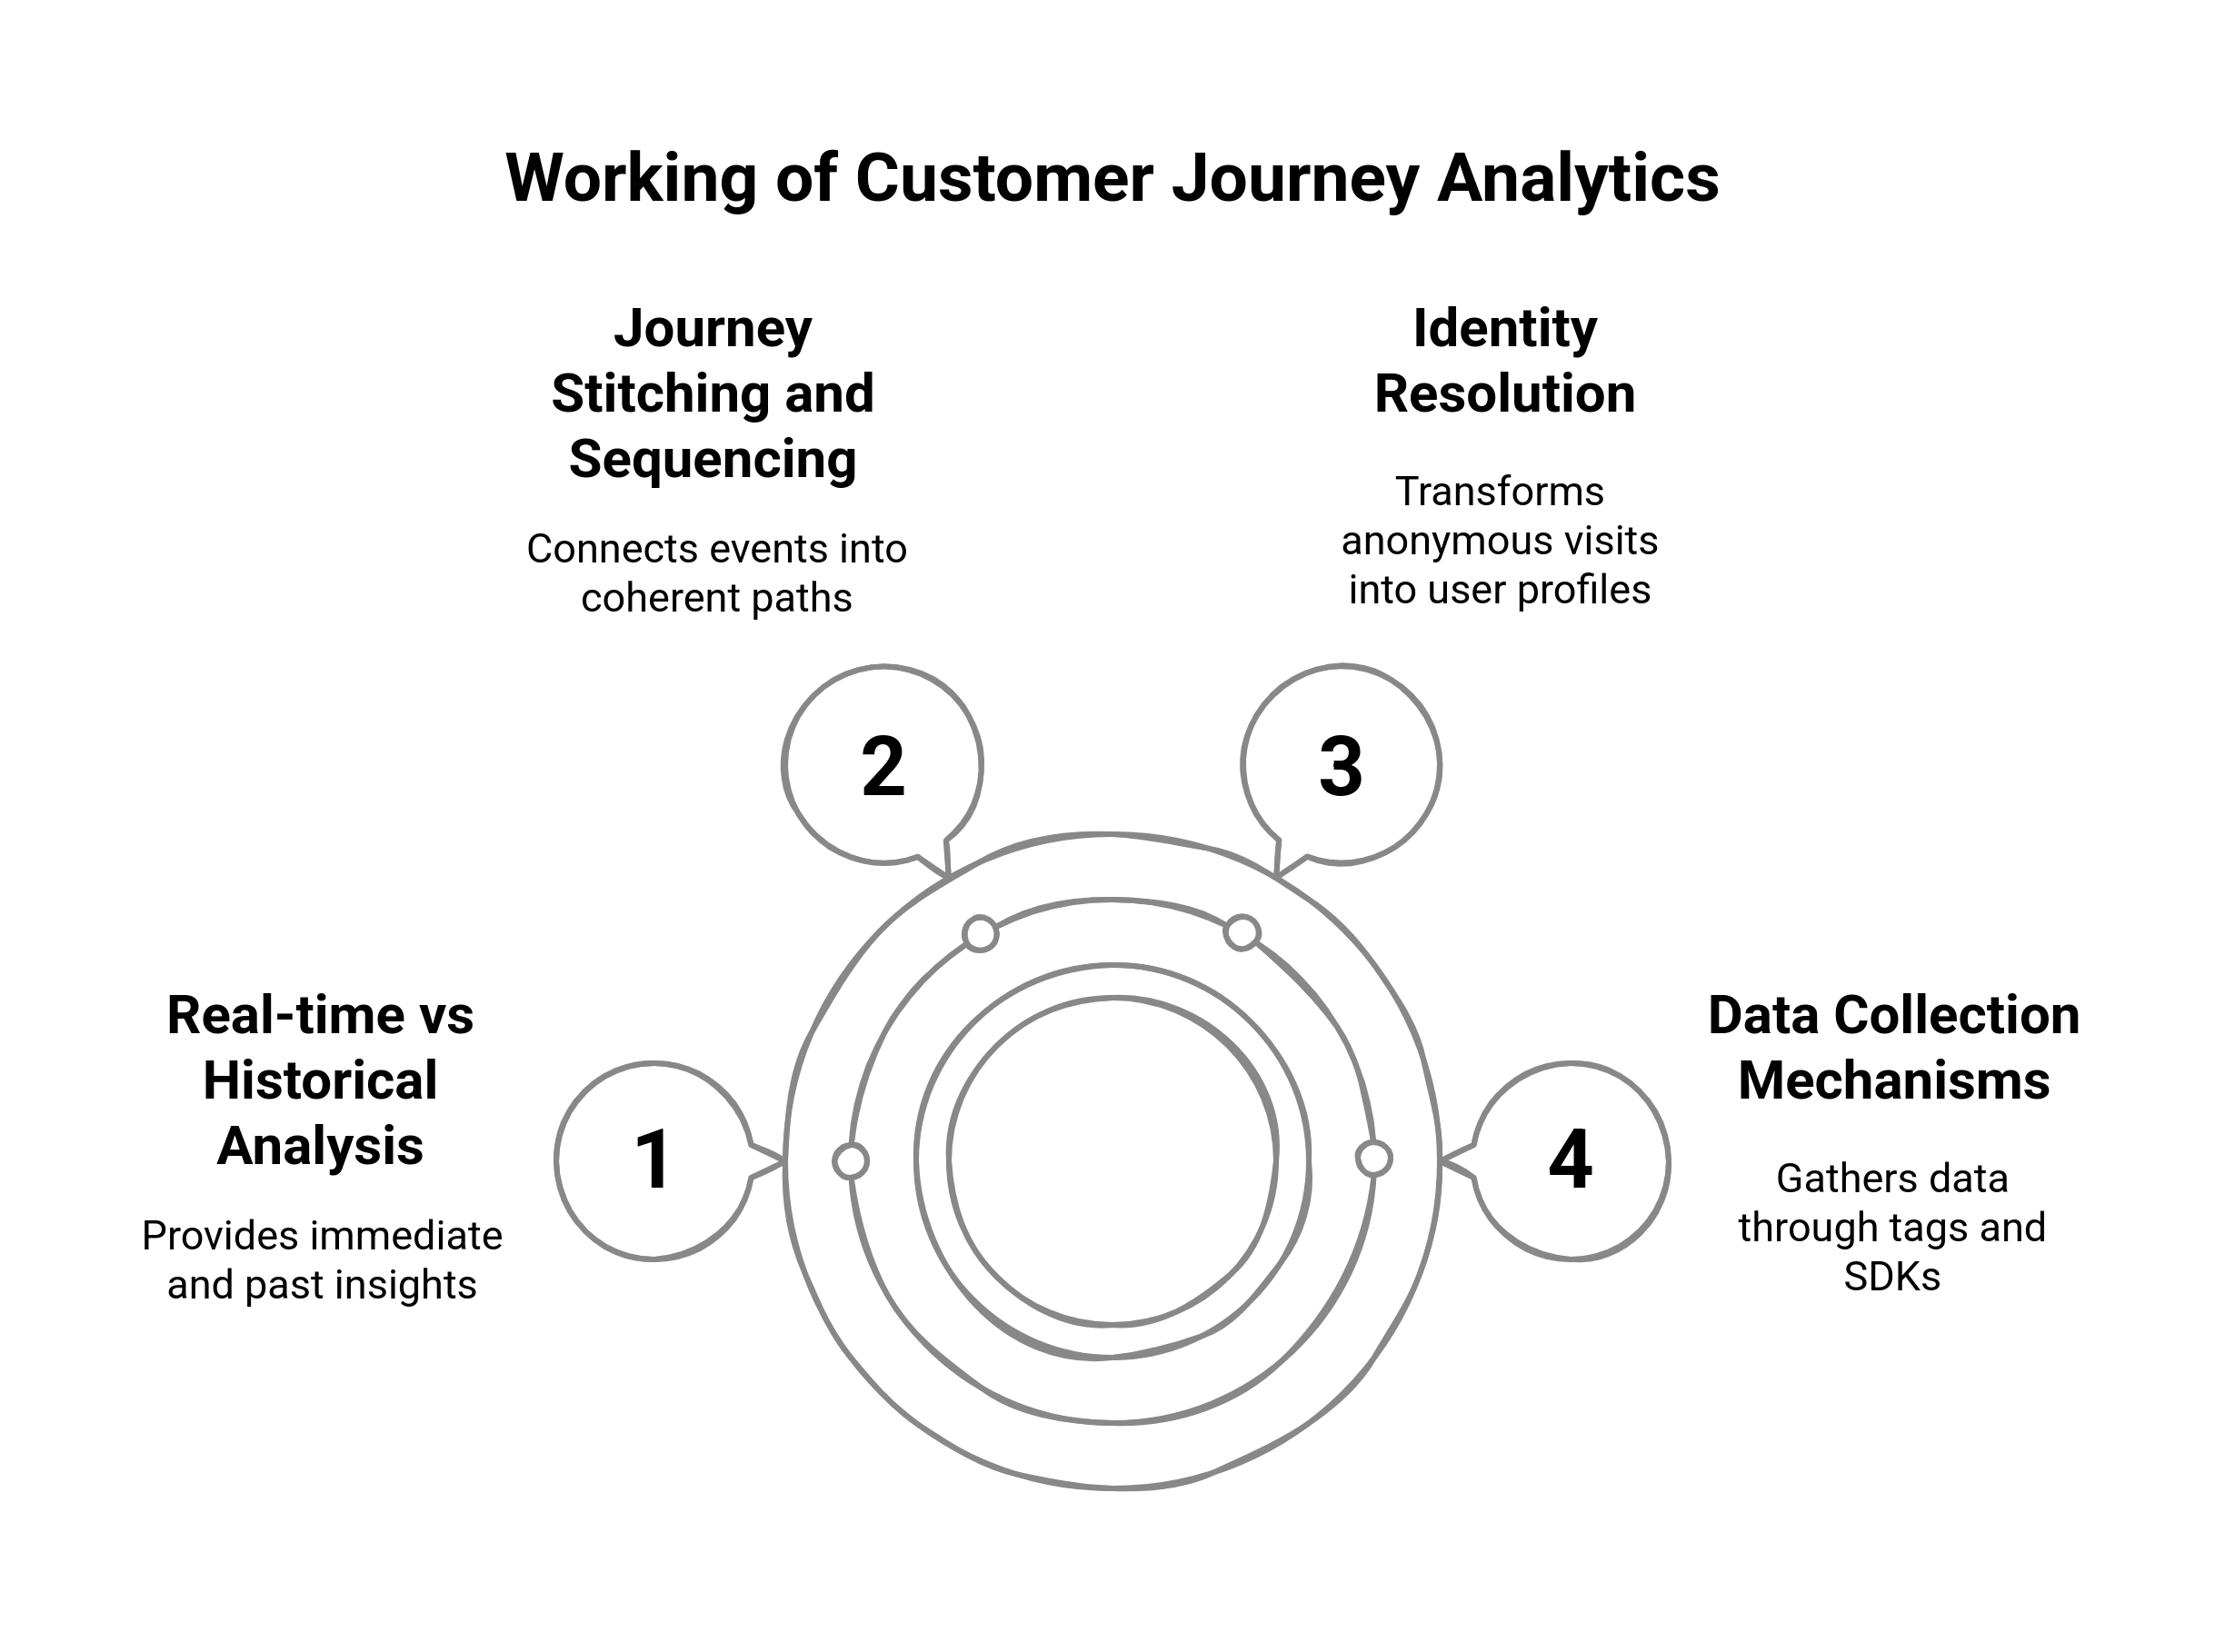
Collection: Tagging, SDKs, and Server-Side Tracking
Data collection begins at the touchpoints. To track consumers across web, mobile, product, and marketing channels, companies are employing a combination of:
JavaScript tags on the websites to track the clicks, views, form fills, scrolls, etc.
SDK for their mobile application to see in-app activities, touch gestures, or feature usage.
Server-side tracking for secure and dependable data captures, especially for backend events such as sign-ups, billing, and product use.
Third-party integrations with CRMs, email platforms, support tools, and ad networks to enrich behavioral data with lifecycle and marketing context
These pipelines continuously power the analytics engine with real-time insights about how users interact at every stage of the customer experience.
Identity Resolution: Anonymity to User Profiles
One of the most critical aspects of customer journey analytics is identity resolution. Users do not usually convert in just one session and may be accessing the channels through various devices or browsers. This is why platform usage can occur through:
Cookies and device fingerprints for session-level tracking
User IDs (from logins, sign-ups, or CRM records) that tie behavior to known individuals.
Probabilistic matching or first-party data (e.g., email clicks, form fills) to try and associate that anonymous behavior with a later authenticated session
This identity resolution fulfills the potential of assembling disparate events into complete user profiles, allowing investigations into the complete journey and not just periodic touchpoints.
Journey Stitching and Sequencing Events over Time
The first step after collecting the necessary data and resolving the identity is journey stitching, which ties together events across sessions and devices to create a timeline of action for each user. That timeline exposes the sequence of behavior: what happened before user sign-up, what touchpoints preceded churn, or how quickly users moved from trial to activation. These sequences can then be further divided into journey cohorts–for example, fast converter vs. slow activator, or filtered by their attributes, like plan type, source, or geography, to tease out patterns. It is this sequencing that gives rise to such minute insights, for example:
Those who visit a pricing page after the demo convert twofold.
60% more likely to churn in fourteen days: users skip onboarding.
3x more likely to upgrade: trial users interact with Feature A in their first three sessions.
This is the analytical core of journey mapping.
Real-time vs Historical Analysis
Real-time analysis plays an essential part when one must go for hurried decision-making-executing live product nudges, displaying exit-intent messages, or directing leads based on their most recent activity. It allows personalized experiences as users are still on your platform. In contrast, historical analysis helps provide the larger framework, spotting long-term trends, assessing campaign success, and modeling behavior across time. It helps answer higher-order inquiries:
Which journeys lead to the highest LTV?
What patterns exist just before churn?
How has buyer behavior changed over the last 6 months?
The robust customer journey analytics platform synergizes real-time and retrospective data, enabling rapid action and profound learning. This is what turns analytics from a simple dashboard into the true growth engine.
Best Tools and Platforms for SaaS Customer Journey Analytics
This kind of stack should facilitate all your customer journey analytics-needing stages beyond the vanity number and superficial dashboards to see how users actually move, convert, and retain through touchpoints. For SaaS teams, such an analytics ecosystem comes along with tools for product insight, customer data unification, and experience optimization. Let us break down categories, such as platforms and features, that should be in place.
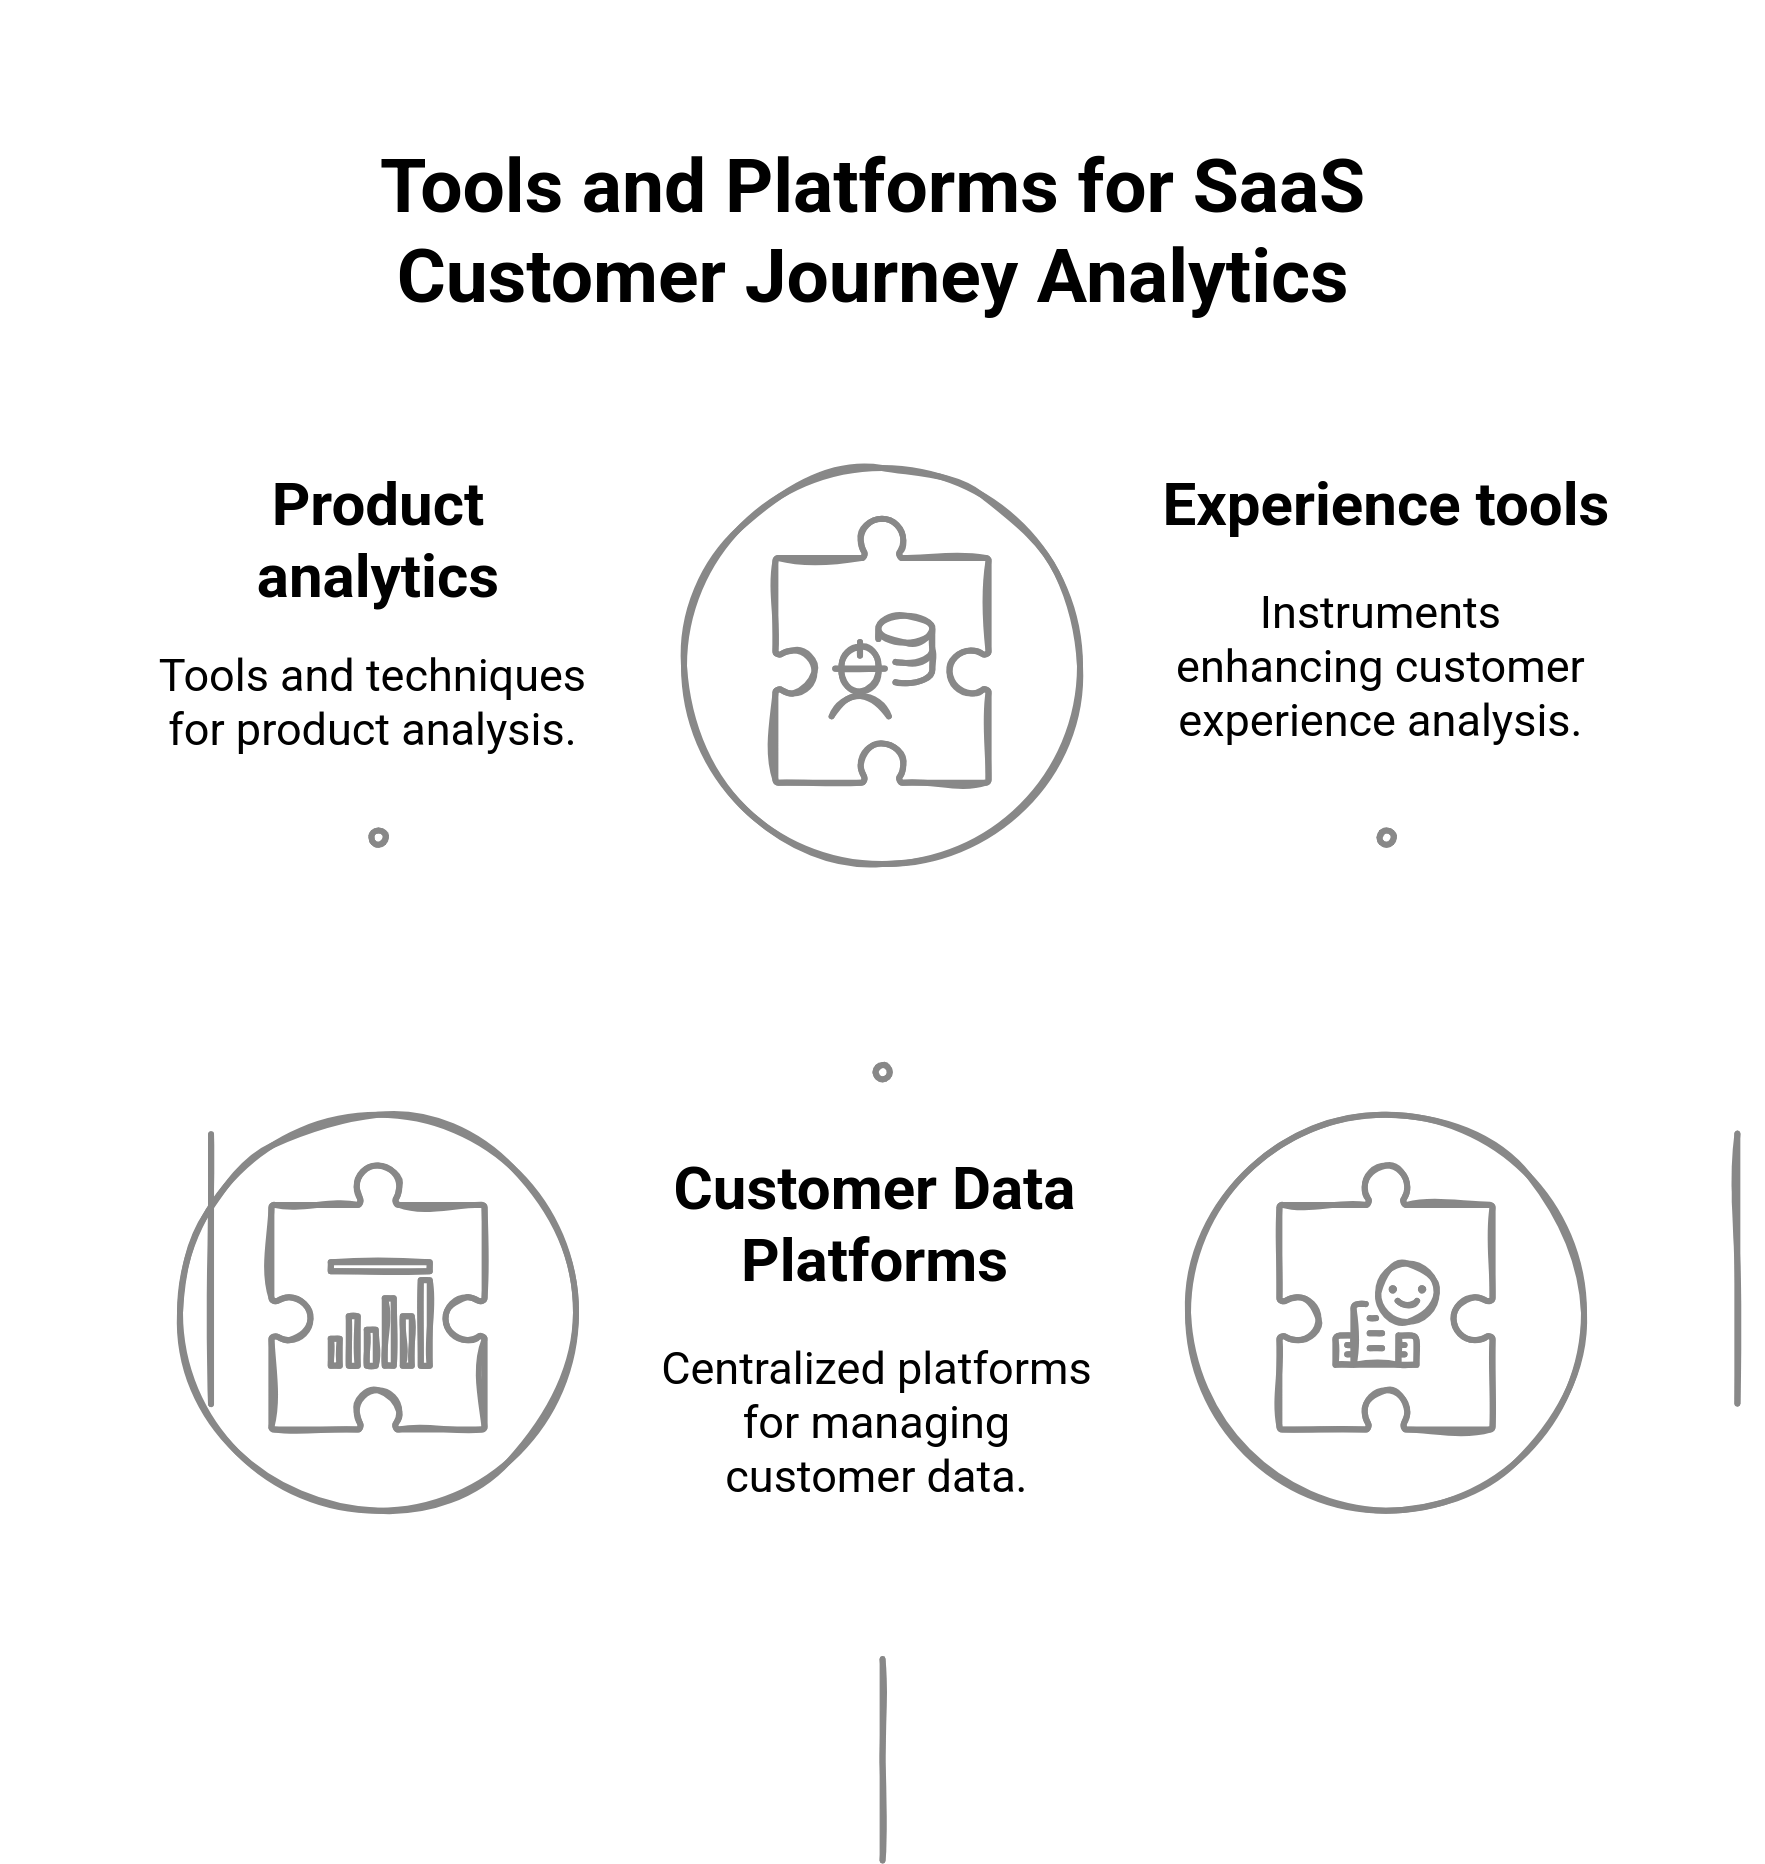
Categories of Tools: Product Analytics, CDPs, and Experience Platforms
- Product Analytics Tools: Platforms like Mixpanel, Amplitude, and Heap focus on user behavior inside your product. They track events, visualize funnels, and analyze retention—all essential for understanding what happens after sign-up or trial activation.
- Customer Data Platforms (CDPs): Tools like Fragmatic help unify data from marketing, product, support, and CRM tools into a single, coherent customer profile. CDPs are foundational for identity resolution and cross-channel journey analysis.
- Experience Optimization Tools: Platforms like Pendo provide product analytics along with in-app messaging, onboarding flows, and usage guidance, allowing you to both measure and influence the customer experience in real time.
These tool categories work best when integrated together—feeding data into a central model, enriching user journeys, and triggering relevant engagement across lifecycle stages.
Features to Prioritize in Journey Analytics Platforms

In examining journey analytics platforms, determine which ones support the most holistic analysis or action against user behaviors:
- Journey Mapping & Path Analysis: Where do users go between touchpoints when they leave?
- Cohort Analysis: What is the performance of different groups over time, e.g., per sign-up date, per plan, or per source of sign-up?
- Retention Monitoring: What is the stickiness of the product and returning users, as well as churn signals?
- Event Sequencing: What are the actions leading to conversion or abandonment?
- Customizable Funnels: Build your funnels for personas, campaigns, or features and compare.
These are more than basic metrics and hold potential for use in evidence-based strategic direction from data analytics and insights into customer behavior.
How to Analyze Customer Journeys for Actionable Results
Collecting journey data is only half the job. The real magic happens when customer journey analysis begins: using that data to generate smart decisions around conversion, churn reduction, and any other maximization of customer experience. This section delivers five key strategic analysis practices that turn raw user activity into significant, measurable actions for the business.
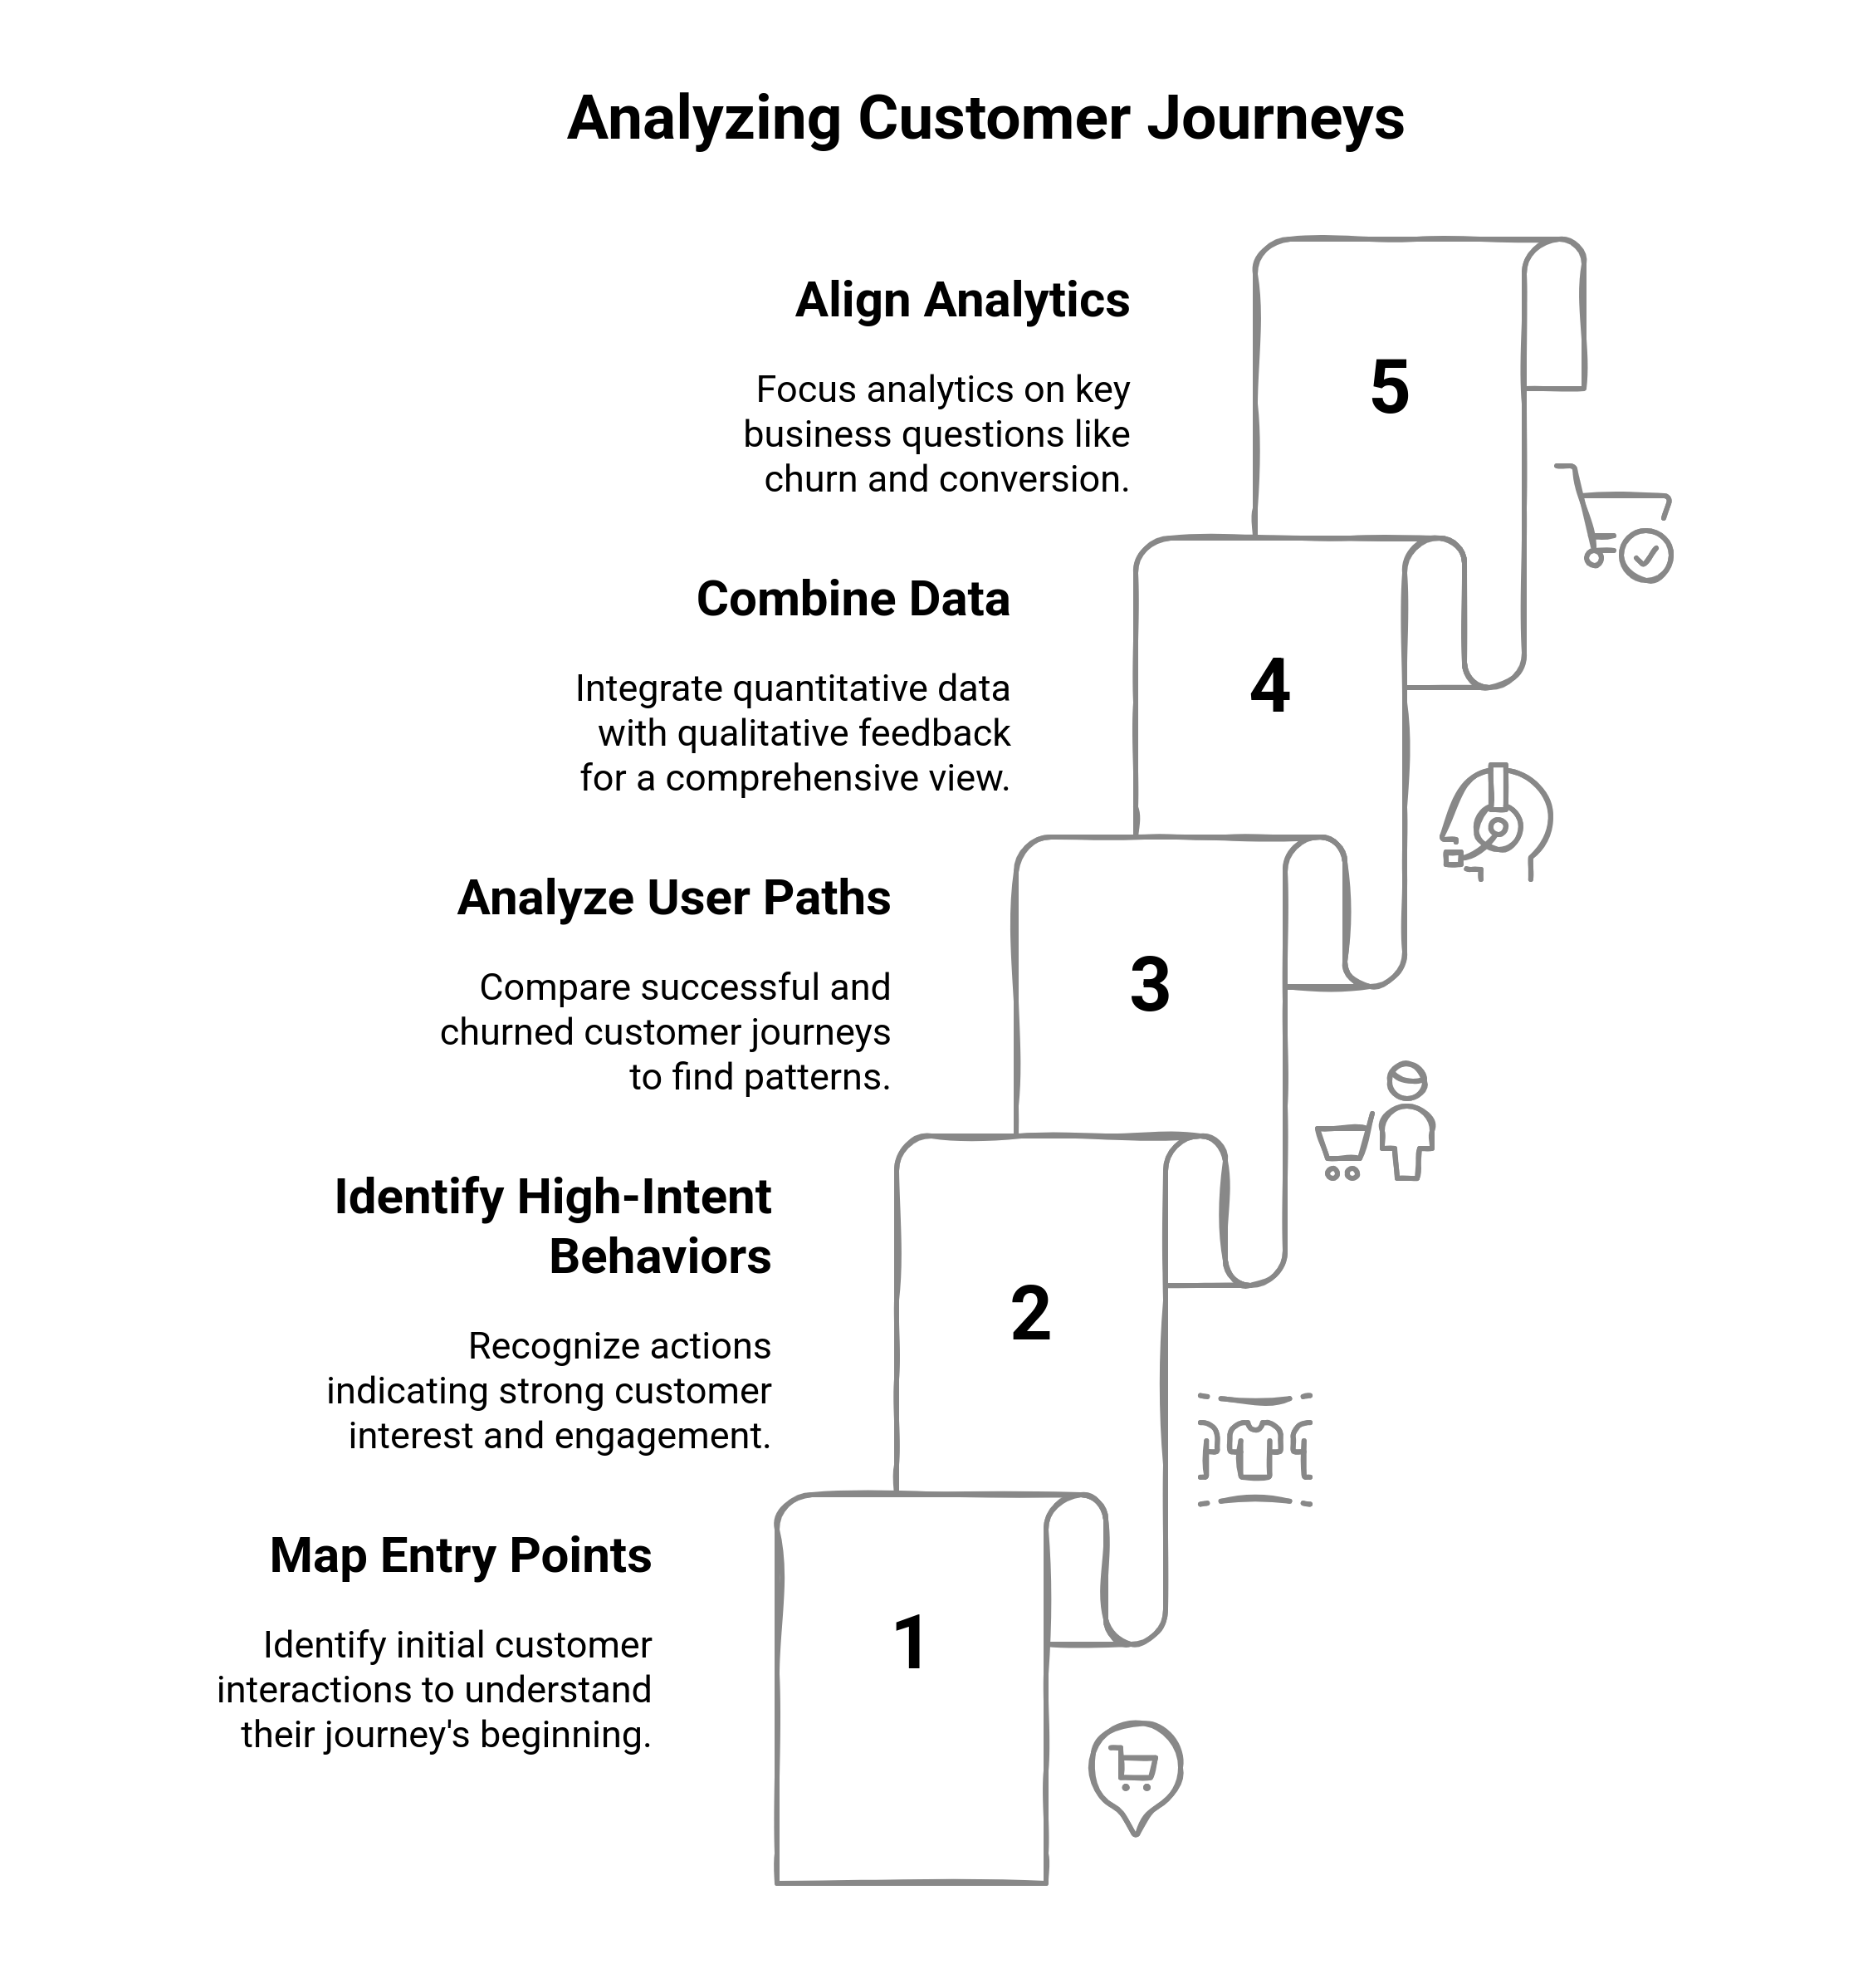
Mapping Entry Points to Long-Term Outcomes
All journeys have a starting point, whether that entry point is an organic visit from a blog site, a placement of a targeted ad, or a referral from a partner. All entry points, however, are not equal; one of the most productive analyses one could run would be tying entry channels with downstream performance to determine:
Do users from LinkedIn convert at a higher rate than those from Google Ads?
Do content-first users retain better than pricing-page-first users?
Does webinar traffic lead to faster expansion?
By linking first-touch or first-session data to long-term metrics like trial completion, onboarding success, or LTV, you optimize your acquisition strategy based on actual business impact-not just clicks or sign-ups.
Identifying High-Intent Behaviors
High-intent activities typically precede meaningful outcomes. They are signals that indicate a user is not just browsing but instead evaluating, making a decision, or on the verge of taking action. In SaaS environments, some high-intent actions available for strategic movement include:
Exploring advanced features or integrations;
Looking at pricing or comparison pages;
Completing onboarding checklists or product tutorials;
Inviting teammates or connecting data sources.
When you can identify what behaviors lead most often to conversions or retention, you can then design nudges, onboarding flows, or sales outreach around those moments of intent. And there you go: taking customer insights and turning them into actions!
Comparing User Paths Across Successful vs Churned Cohorts
User paths analyzing customer journeys are among the powerful applications that could focus on comparing different cohorts of users, with the most distinctive comparison being between a power user versus a churned customer. Ask these questions:
Which steps did retained users take that the churned did not?
How fast did a successful user activate compared to a dropout?
What features or patterns correlate with engagement longevity?
There are path and funnel comparison tools available to see where journeys diverge and proactively direct new users toward proven paths while redesigning journeys that consistently underperform.
Combining Qualitative Feedback Alongside Quantitative Patterns
Numbers tell you what’s happening, but not always why. To truly understand user behavior, combine quantitative data with qualitative insights:
Session replays and heatmaps allow the discovery of any usability friction.
Through support tickets, CSM notes, or user surveys, hear pain points directly from users.
NPS follow-up feedback could yield themes in promoter vs. detractor journeys
That combined view lets you decipher not only the sequence of events but the experience around it, something that raw numbers cannot reveal.
Aligning Analytics to Business Questions
The most effective journey analysis starts with a sharp business question:
What behavioral indicators point out the customer churn cases 30 days before the event?
What's the most common journey in our highest LTV customers?
What onboarding paths tend to facilitate higher product adoption rates?
This framing of analysis against real, high-impact outcomes helps to steer clear of vanity metrics and expose insights that genuinely serve product, marketing, and success teams.
How to Set Up Customer Journey Tracking from Scratch
Evaluation processes or decisions cannot be formulated just like that. You have to put in place tracking before assessing or acting upon the actions of end-users. This is the assurance that your marketing analytics, product insights, and engagement strategies are built on fact rather than conjecture. And whether you're starting over fresh or cleaning up a nasty setup, here are ways to build sturdy analytic foundations by starting from scratch.
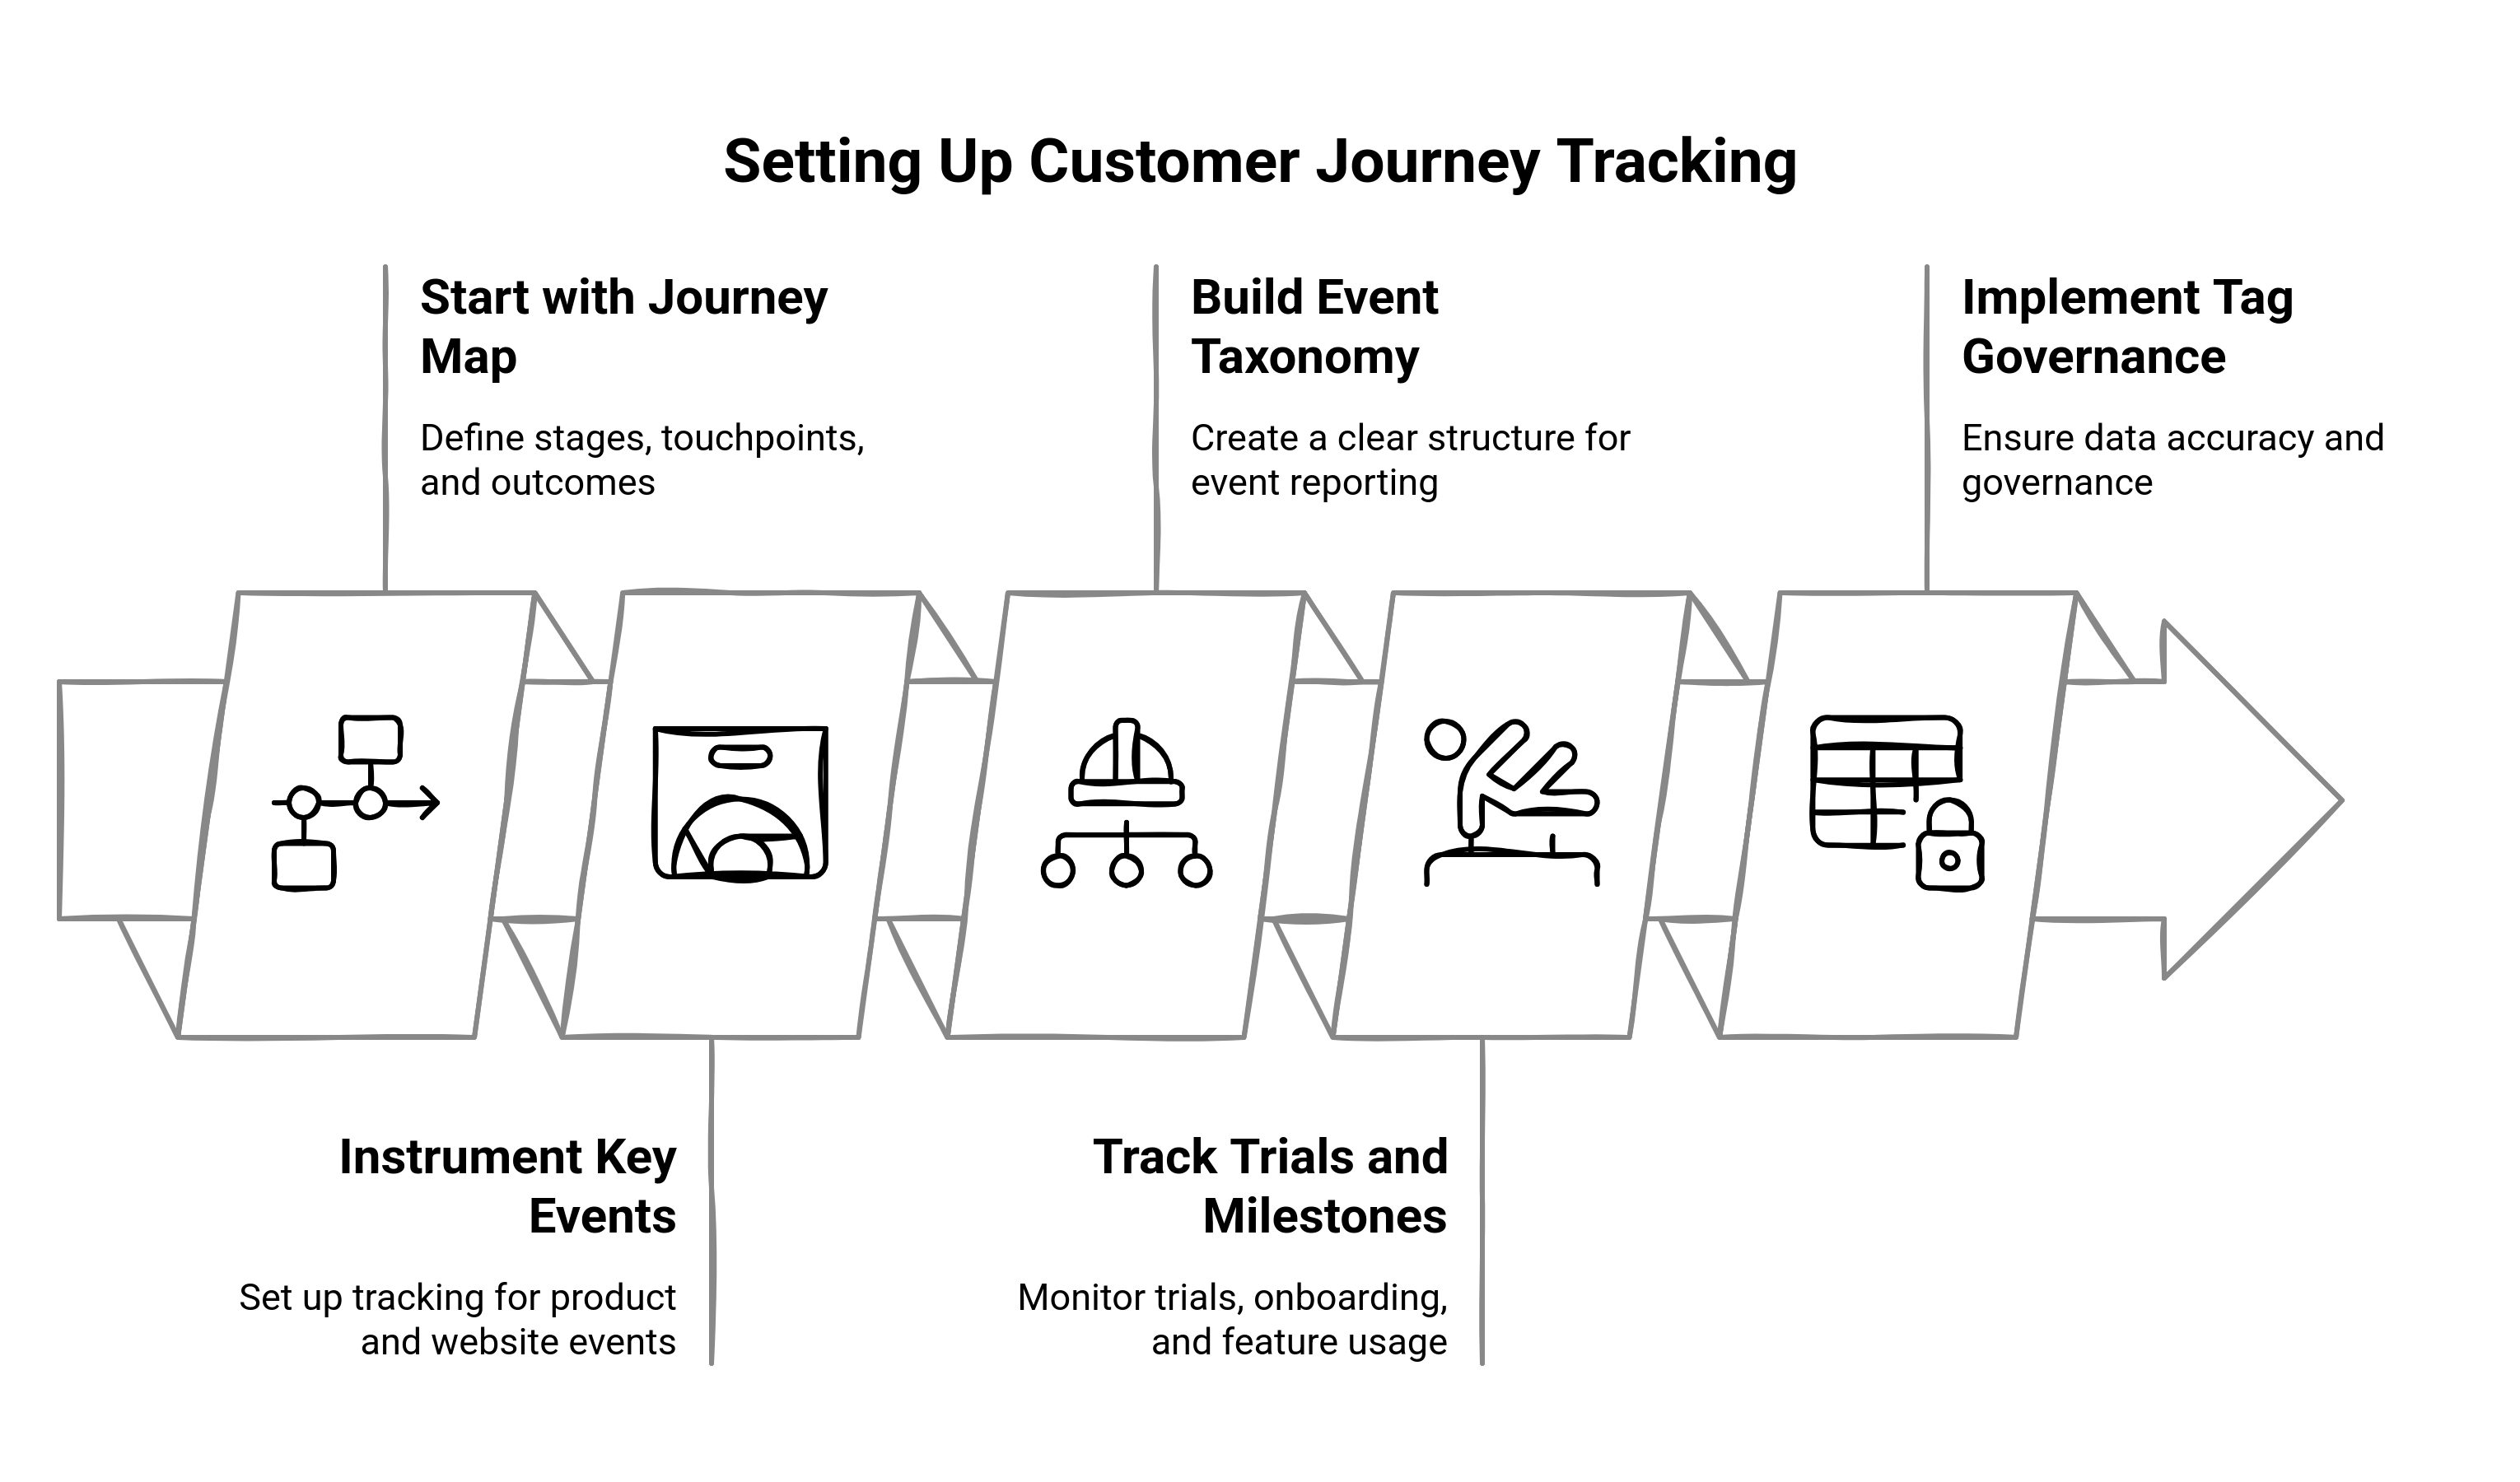
Start with Your SaaS Journey Map: Stages, Touchpoints, Outcomes
Your first step is not writing a line of code; it is clarity. Draft your SaaS customer journey map from Awareness to Advocacy. Identify the critical stages, such as:
Awareness: where users first discover you (ads, content, word of mouth)
Evaluation: looking at product pages, use cases, trials (Evaluation and consideration)
Activation: onboarding flows, first-value moments
Retention & Expansion: feature usage, cross-sells, account growth
Advocacy: NPS, reviews, referrals
For every stage, you enumerate the touch points (pages, features, channels) and the desired outcome (e.g., booked demo, trial signup, activated integration). This map becomes the blueprint for what you track and why.
Instrumenting Key Product and Website Events
After the journey has been mapped, proceed with event instrumentation, adding the code to trace all users' activities on both the web and product environment. Concentration on capturing the high-value behaviors will be:
Page Views: homepage, pricing, docs, demo booking
Clicks: the sign-up, CTA buttons, and feature tabs.
Custom product events: feature used, integration enabled, teammate invited.
Conversion milestones: trial started, checklist completed, and payment submitted.
Building a Clear Event Taxonomy for Clean Reporting
Messy data kills analysis. Create a standardized event taxonomy—a shared structure for naming events, properties, and user traits. For example:
Signup Started
Trial Activated
Feature Used: Dashboard Export
Milestone: Invited Teammate
Plan Upgraded
Define naming conventions (e.g., lowercase, underscores vs spaces), required properties (e.g., plan type, source), and documentation rules. This ensures events are readable, scalable, and easy to report on.
Measured Events, Stages of Onboarding, and Product Usage
In the SaaS arena, usage varies greatly. You should:
Track Trial behaviors: sign-up date, days tracked, trial expiration
Track Onboarding milestones: tutorial completion, checklist? completion, feature exploration?
Monitor Activation moments: time to the first value, data import, team invite?
Adoption trends: usage frequency, return rate, feature engagement
These aren’t vanity metrics—they’re leading indicators of conversion, retention, and growth. Track them consistently and benchmark performance across cohorts.
Tag Governance and Data Accuracy Best Practice Attributes
Do not wait for the chaos, invent a prevention plan in your tracking setup on day one:
Monthly audits of events: removing deprecated ones, looking after inconsistencies.
Version control and change logs: keeping track of event updates across teams.
Keeping GTM or similar systems clean and documented through tag manager hygiene.
Testing protocols: QA-ing new events before joining in staging + production.
Cross-functional alignment: Make PMs, engineers, marketing, and success teams converse in a single data language.
Tracking the customer's journey is not a project only based on technology—it's an operational discipline. It demonstrates that you can trust your dashboards, that what they are showing is really how customers behave.
Visualizing Buyer Journeys: Examples and Templates
An ever-increasing amount of data becomes even more valuable if it is legible, disseminable, and actionable. That's why visualizing customer journeys makes so much sense. Effective journey visualization yields success in identifying drop-offs, revealing worthwhile pathways, and cross-departmental communication of opportunities through marketing, products, and CS teams. This section will discuss formats, tools, and real SaaS customer examples.
Recommended Formats for Journey Visualization
Different journeys call for different types of visualization. The following are best suited for SaaS scenarios:
- Path Diagrams: The following will be exhibited in branching flows of events: from pricing page-trial-onboarding-inactivity vs conversion. Finds curious nonlinear patterns and outliers.
- Journey Flowcharts: Exhibit stage-by-stage progress—awareness to conversion to retention—associated with key behaviors and conversion rates. Excellent for exec overviews or team alignment.
- Heat-based Journey Maps: i.e., visual overlays (heat maps over product flows or pages) that indicate volume or intensity of drop-off. The most effective maps for finding and analyzing friction during onboarding or UI navigation.
There is no single image that really provides an overview of the journey. Best visuals are not static; they are tools for diagnosis, strategy, and experimentation.
Visualizing Drop-offs in Trials, Paths to Activation, and Renewal Flows
Let’s break down how visualization helps across different SaaS lifecycle points:
- Trial Drop-Offs:
- Example: A funnel or path analysis from "Trial Signup" → "Onboarding Start" → "Feature Used" → "Plan Upgrade.”
- Visual Insight: What is usually seen is that most users drop off before initiation of the onboarding process, indicating an absence of nudges for activation.
- Activation Paths
- For example, a Sankey diagram of various behaviors after first login—some users jump right into advanced features, while others get stuck on the dashboard.
- Visual Insight: Knowing that you have the most efficient routes to 'Time-to-First-Value' and replicating that journey through guided onboarding.
- Renewals and Retentions Flows
- Example: Map usage patterns from month 1 to month 6 of paying users and overlay churn risk cohorts on top.
- Visual Insight: Users utilizing consistently X and Y features renew at 80%, while others with minimal activity just become former users. Fuel success team playbooks accordingly.
Examples from Successful SaaS Tools: Freemium vs. Enterprise Journeys
Different SaaS models require different visual storytelling:
- Freemium SaaS (e.g., Notion, Grammarly)Journey maps often emphasize volume and activation depth. You’ll visualize:
- % of free users who cross key activation thresholds
- Upgrade journey over time (e.g., feature used → limit hit → upgrade prompt)
- Heatmaps of feature discovery and frequency
- Enterprise SaaS (e.g., HubSpot, Asana Business)Visuals lean more toward account-level behavior and expansion trends:
- Journey from first stakeholder visit → team onboarding → procurement → usage by multiple roles
- Graph-based views of user roles, behaviors, and seats added over time
- Renewal risk heatmaps based on account usage consistency
Visuals here help sales, CS, and product collaborate around real-time account health, not just individual behaviors.
Conclusion
In a crowded SaaS landscape where products are often comparable, customer experience becomes the differentiator. And the key to delivering that experience—consistently, intelligently, and at scale—is mastering your customer journey analytics.
Understanding the full buyer journey isn’t just about tracking clicks or optimizing funnels. It’s about decoding user behavior, discovering the invisible drivers behind activation and churn, and making smarter decisions across marketing, product, and success teams. When you can visualize how real users move, struggle, and succeed inside your product, you gain a blueprint for growth rooted in truth, not assumptions. So, whether you’re just getting started with data analytics or fine-tuning a mature setup, the opportunity is clear: turn raw behavior into refined action. Map your journey, instrument it thoughtfully, analyze it deeply, and build the kind of experience that doesn’t just convert—but retains, expands, and earns loyalty. Customer journey analytics isn’t a dashboard project. It’s a growth discipline. Now’s the time to own it.