Introduction
Stories sell. That’s not just a cliché, it’s marketing 101. In B2B, where decisions are often driven by logic, data, and ROI, storytelling might seem secondary. But here’s the truth: even the most analytical buyers crave narratives that make sense of the numbers. They don’t just want statistics thrown at them; they want stories that give those numbers meaning.
For years, B2B marketers have relied on traditional storytelling—broad messaging, generic case studies, and one-size-fits-all campaigns. But audiences have changed. Buyers no longer settle for vague promises; they want proof. They want content that’s not just engaging but backed by real-world insights, personalization, and measurable impact. This is where data-driven storytelling comes in. It transforms abstract claims into undeniable facts, shifting content from "this sounds nice" to "I need this."
Think about it. Would you rather hear, “Our platform increases conversions” or “Companies using our platform see a 32% increase in conversions, with an average revenue lift of $500K per year”? The second one? Exactly. That’s the power of data-driven storytelling. It doesn’t just capture attention—it builds trust, drives action, and makes marketing impossible to ignore. In this blog, we’ll break down what data-driven storytelling really means in B2B marketing, how brands are using it to drive engagement and growth, and how you can apply it to your own strategy.
Understanding Data-Driven Storytelling
At its core, data-driven storytelling is the fusion of numbers and narratives. It’s not just about inserting stats into marketing materials—it’s about using data to craft compelling stories that resonate with your audience on both a rational and emotional level.
A strong data-driven story consists of three core elements:
- A relatable narrative – A challenge, opportunity, or trend that matters to your audience.
- Relevant data – Insights that validate the story and make it credible.
- A clear takeaway – A conclusion that drives action or a shift in perspective.
Unlike traditional storytelling, where creativity drives the plot, data-driven marketing ensures that every story is rooted in reality, making it more persuasive and impactful.
How Data Transforms Narratives in B2B Marketing
B2B buyers don’t just want a good story; they want proof. A compelling narrative backed by data turns broad claims into undeniable truths. Instead of saying, “Our solution improves conversion rates,” a data-driven approach states: “Our solution has increased conversions by 32% for companies in the SaaS industry.”
This shift makes a huge difference. It moves content from being opinion-based to evidence-based, making it more trustworthy and engaging. Data also enables hyper-personalization, meaning businesses can tell stories tailored to specific industries, roles, or challenges—not just generic marketing fluff.
The Psychology Behind Storytelling and Decision-Making
Humans process stories 22 times faster than standalone facts. Why? Because stories engage both the logical and emotional parts of the brain. Neuroscience shows that when we hear a compelling story, our brains release dopamine, making it easier to remember and relate to.
B2B decision-makers may justify purchases with logic, but their initial reactions are emotionally driven. A well-crafted data-driven content marketing approach taps into this by:
- Building trust – Data validates your claims, reducing skepticism.
- Creating urgency – Trends and stats highlight risks and opportunities.
- Simplifying complexity – Turning raw numbers into easy-to-understand insights.
One of the best examples of data-driven storytelling in action is Spotify Wrapped. Each year, Spotify takes user data—top artists, genres, minutes streamed—and turns it into a personalized, shareable story. The result here is massive social engagement, stronger brand loyalty, and viral marketing at scale.
B2B brands can do the same. LinkedIn’s ‘Workplace Learning Report’ is a perfect example—rather than just listing statistics, LinkedIn crafts an insightful narrative around emerging workplace trends, making the data more digestible and actionable. The key takeaway here is data doesn’t have to be dry. When turned into a compelling story, it not only educates but also persuades, engages, and drives real impact.
Why Data-Driven Storytelling is Essential for B2B Growth
B2B marketing has long been dominated by logic-driven messaging, but in a landscape where buyers are overwhelmed with information, storytelling has become a powerful differentiator. The challenge? Traditional storytelling alone isn’t enough to convince data-savvy decision-makers. That’s where data-driven storytelling comes in—turning raw insights into persuasive narratives that capture attention, build trust, and drive action.
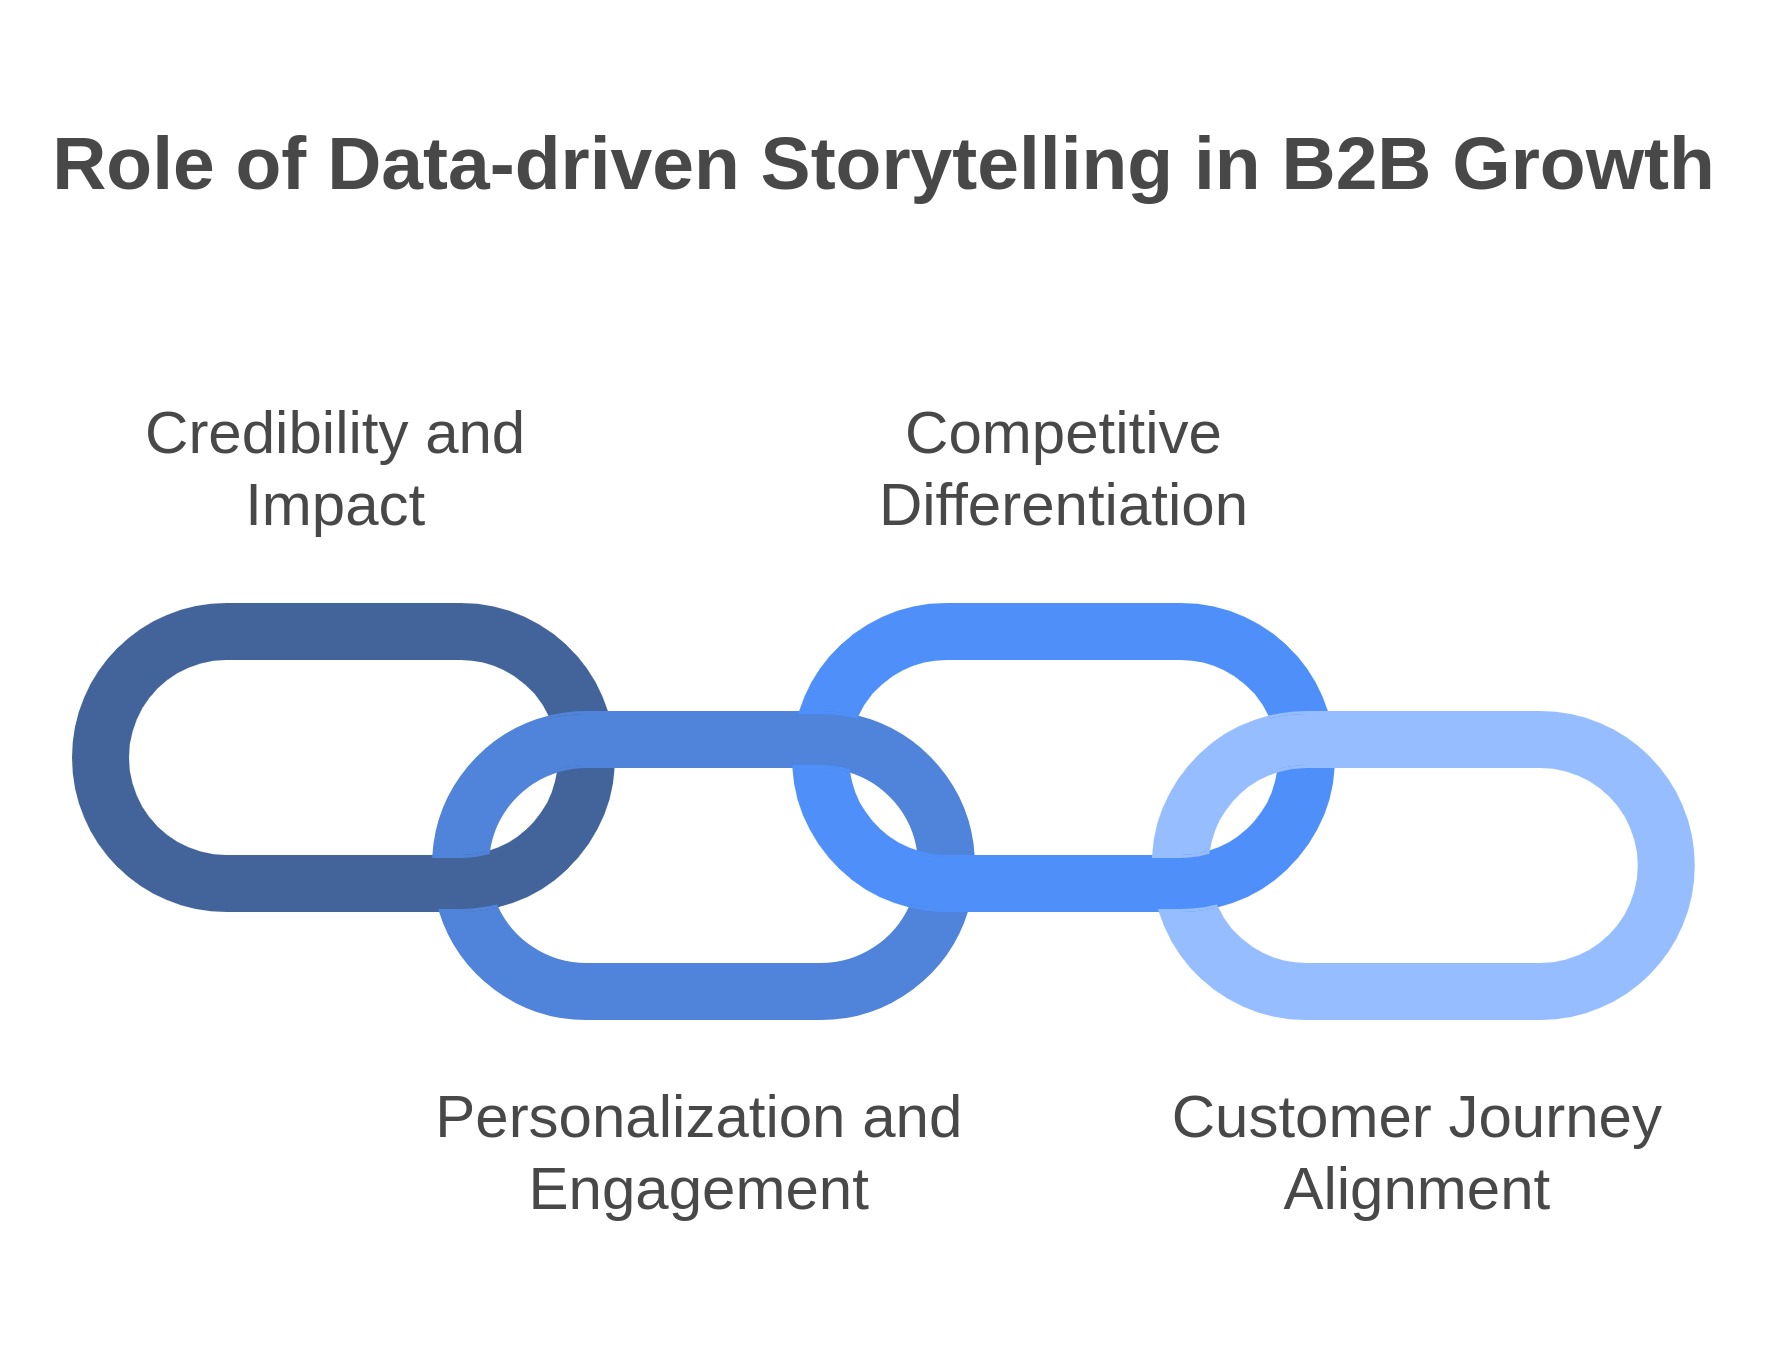
This section explores how data-driven marketing enhances credibility, fuels personalization, strengthens competitive positioning, and aligns seamlessly with different stages of the customer journey.
Role of Data in Making Marketing More Credible and Impactful
B2B buyers don’t just take a company’s word for it—they need evidence. Data shifts storytelling from anecdotal to authoritative. Instead of broad, subjective claims, businesses can use real performance metrics, customer insights, and market trends to substantiate their messaging.
For example, rather than stating, “Our solution enhances productivity,” a data-backed approach would say, “Companies using our platform report a 40% increase in team productivity within three months.” The difference? The first is a vague assertion, while the second presents concrete proof, making the message far more credible and persuasive.
Beyond building trust, data also makes content more impactful. B2B buyers constantly evaluate ROI, risks, and industry benchmarks. By weaving relevant data into marketing materials—whether blog content, case studies, or reports—brands can position themselves as thought leaders rather than just another vendor making claims.
How Storytelling with Data Improves Personalization and Engagement
Personalization is no longer a nice-to-have in B2B marketing; it’s an expectation. However, true personalization isn’t just about using a prospect’s name in an email—it’s about delivering content that resonates with their specific challenges, industry, and stage in the buying process.Data plays a crucial role in this. By leveraging behavioral insights, firmographic data, and intent signals, businesses can craft narratives that speak directly to different audience segments. For instance, a company selling marketing automation software could create different data-driven stories for enterprise CMOs, mid-sized business marketers, and startup founders—each tailored to their unique pain points and goals.
A great example of this is HubSpot’s State of Marketing Report. Instead of presenting a generic summary of industry trends, HubSpot segments its insights based on company size, industry, and marketing maturity. This makes the report highly relevant to different personas, increasing engagement and perceived value.
Data as a Differentiator in Competitive B2B Markets
In saturated industries, most competitors offer similar products, features, and benefits. What separates leading brands from the rest is how they tell their story—and data is a powerful tool in this differentiation. Consider how two companies selling cybersecurity solutions might approach their messaging. A generic approach might be: “We offer top-tier security for enterprises.” But a data-driven approach could be: “Our solution has reduced security breaches by 73% for enterprises handling sensitive customer data.” The second approach doesn’t just tell buyers what the product does—it quantifies its value, making it stand out in a crowded marketplace.
Additionally, leveraging proprietary data in storytelling can make marketing content more unique. Brands that publish original research, benchmark reports, or insights derived from their own customer data establish themselves as industry authorities, making their marketing harder to replicate.
Aligning Storytelling with Customer Journey Stages
Not all prospects are at the same stage in the buying process, which is why storytelling with data should evolve alongside the customer journey.
- Awareness Stage: At this stage, prospects are identifying challenges and exploring potential solutions. Data-driven blog posts, industry reports, and infographics can help educate them on emerging trends and industry benchmarks. For instance, a company selling AI-powered sales tools could publish a report on “How AI is Increasing Sales Productivity by 35% in B2B Companies.”
- Consideration Stage: Buyers are now evaluating different solutions. This is where case studies, comparison reports, and data-backed whitepapers come in. A strong case study could highlight how a company achieved a measurable business outcome using the product, reinforcing its value.
- Decision Stage: Prospects are ready to make a purchase, but they need reassurance. At this point, using data in ROI calculators, customer testimonials with quantifiable results, and competitive analyses can give them the final push they need to commit.
Key Elements of a Successful Data-Driven Storytelling Strategy
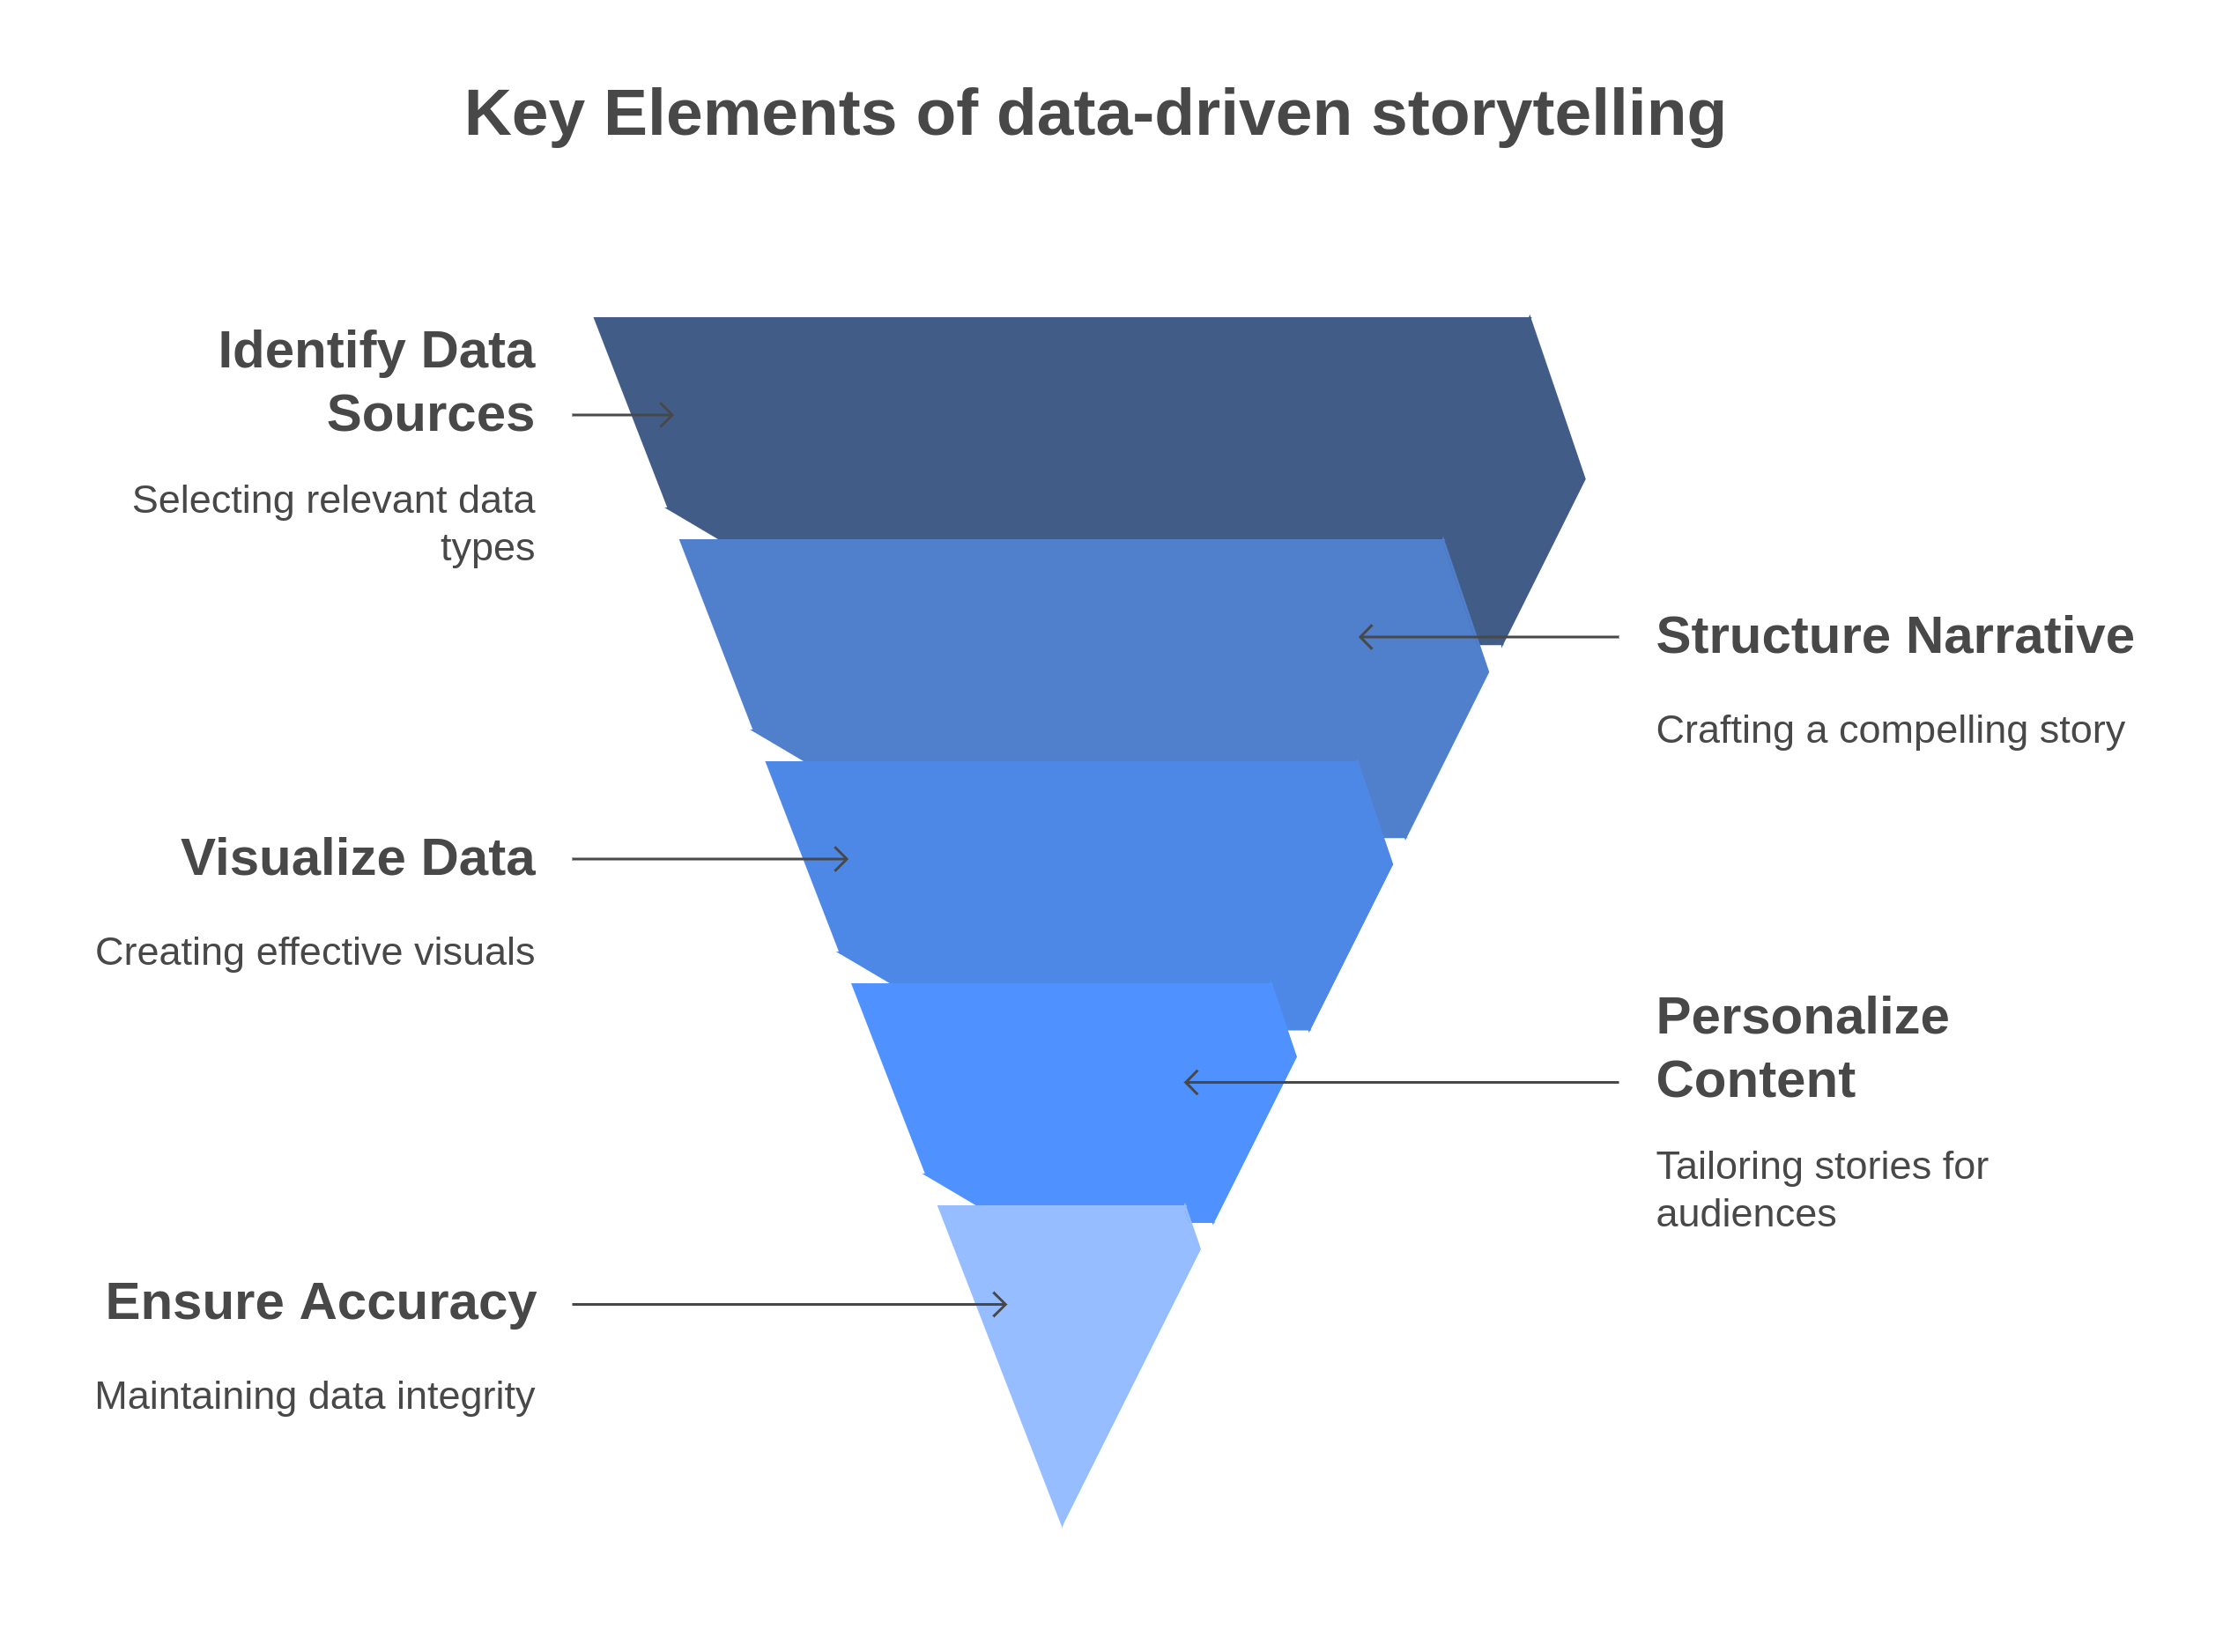
A compelling data-driven storytelling strategy isn’t just about throwing statistics into marketing materials—it requires a thoughtful approach to sourcing, structuring, visualizing, and personalizing data while ensuring credibility. This section breaks down the essential components that make storytelling with data truly effective.
Identifying the Right Data Sources
Before crafting a compelling narrative, businesses need to ensure they are pulling from reliable and diverse data sources. The right mix of data can transform an ordinary story into a persuasive, insight-driven piece of content.
First-party data: Data collected directly from customers—such as CRM insights, website analytics, and in-product behavior—offers the most authentic foundation for storytelling. For example, an email marketing platform might analyze its users’ open rates and use that data to create a report on “The Best Email Subject Lines That Increase Open Rates by 27%.”
Third-party data: Industry reports, market research studies, and benchmark data from sources like Gartner, Forrester, and LinkedIn add credibility and broader industry context.
Customer insights: Surveys, testimonials, and case studies provide qualitative depth to support quantitative findings. These insights bring the numbers to life by showing how real customers experience results.
Additionally, businesses must strike a balance between quantitative and qualitative data. While numbers establish authority (e.g., “This strategy increased conversions by 40%”), qualitative insights—such as direct quotes and customer stories—make the message more relatable and engaging.
Structuring Your Narrative with Data
Even the most valuable data will fall flat without a strong narrative structure. The key is to organize insights in a way that makes the story compelling, digestible, and action-driven. One of the most effective storytelling frameworks in B2B marketing is the hero’s journey:
The Challenge: Introduce a problem that resonates with your target audience. For example, “B2B marketers struggle with low engagement rates in content marketing.”
The Solution: Introduce data that frames the turning point. “Brands that use data-driven content see 2x higher engagement and 30% more conversions.”
The Resolution: Show real-world proof of success with case studies, statistics, and customer testimonials. “Company X implemented a data-backed content strategy and increased inbound leads by 45%.”
This structure can be applied across various content formats, including:
Case studies: Showcasing how businesses achieved measurable success using real data.
Industry reports: Analyzing trends, benchmarks, and insights from proprietary research.
Interactive content: ROI calculators, dynamic infographics, or AI-driven reports that engage users with data in real time.
Videos: Motion graphics and animations that transform statistics into engaging visuals.
Visualizing Data Effectively
Raw numbers can be overwhelming. The way data is presented significantly impacts how well it resonates with an audience. Well-designed data visualizations help simplify complex insights and make them easier to remember.
Best Practices for Data Visualization
Choose the right format:
Line charts for trends over time
Bar charts for comparisons
Pie charts for proportions
Heatmaps for identifying patterns
Keep it simple: Avoid cluttered graphs. The goal is clarity, not complexity.
Highlight key takeaways: Instead of displaying entire datasets, focus on the most relevant insights that drive the narrative forward.
Maintain brand consistency: Use company colors and fonts to align data visualizations with the overall brand identity.
Top Tools for Data Visualization
Google Data Studio: Ideal for building interactive reports and dashboards.
Tableau: A powerful tool for complex data visualization and analytics.
Canva: Great for creating simple, visually appealing infographics.
Flourish: A flexible tool for creating interactive charts and graphs.
Personalization at Scale
With AI and predictive analytics, personalized storytelling is no longer limited to one-to-one interactions—it can be scaled efficiently across thousands of prospects.
AI-driven content recommendations: Platforms like Clearbit and 6sense use real-time behavioral data to tailor content recommendations.
Dynamic website personalization: Tools like Fragmatic enable B2B brands to serve personalized content, headlines, and CTAs based on visitor data.
Predictive storytelling: By analyzing historical data, businesses can forecast what type of content different audience segments are most likely to engage with.
A great example of personalization at scale is Spotify Wrapped. While a B2C example, the concept is highly relevant to B2B: using customer-specific data to create a tailored storytelling experience. B2B brands can apply this by delivering personalized reports, dashboards, and insights based on user interactions.
Ensuring Data Accuracy and Trustworthiness
In an era of misinformation, data integrity is crucial. Misleading statistics or manipulated data not only damage credibility but can also have legal repercussions.
Avoiding Misleading Stats
Always cite sources: If using third-party research, include proper attribution.
Be transparent about methodology: Explain how data was collected, what sample size was used, and any limitations.
Avoid cherry-picking: Select data that represents a full, unbiased picture rather than only insights that support a particular agenda.
Ethical Storytelling in B2B Marketing
Consent and privacy: If using customer data in a story, obtain permission first.
Honest representation: Avoid exaggerating numbers or drawing false conclusions.
Diversity in storytelling: Represent a broad range of customers and industries in data-driven narratives to ensure inclusivity.
How to Leverage Data-Driven Storytelling for Maximum Impact
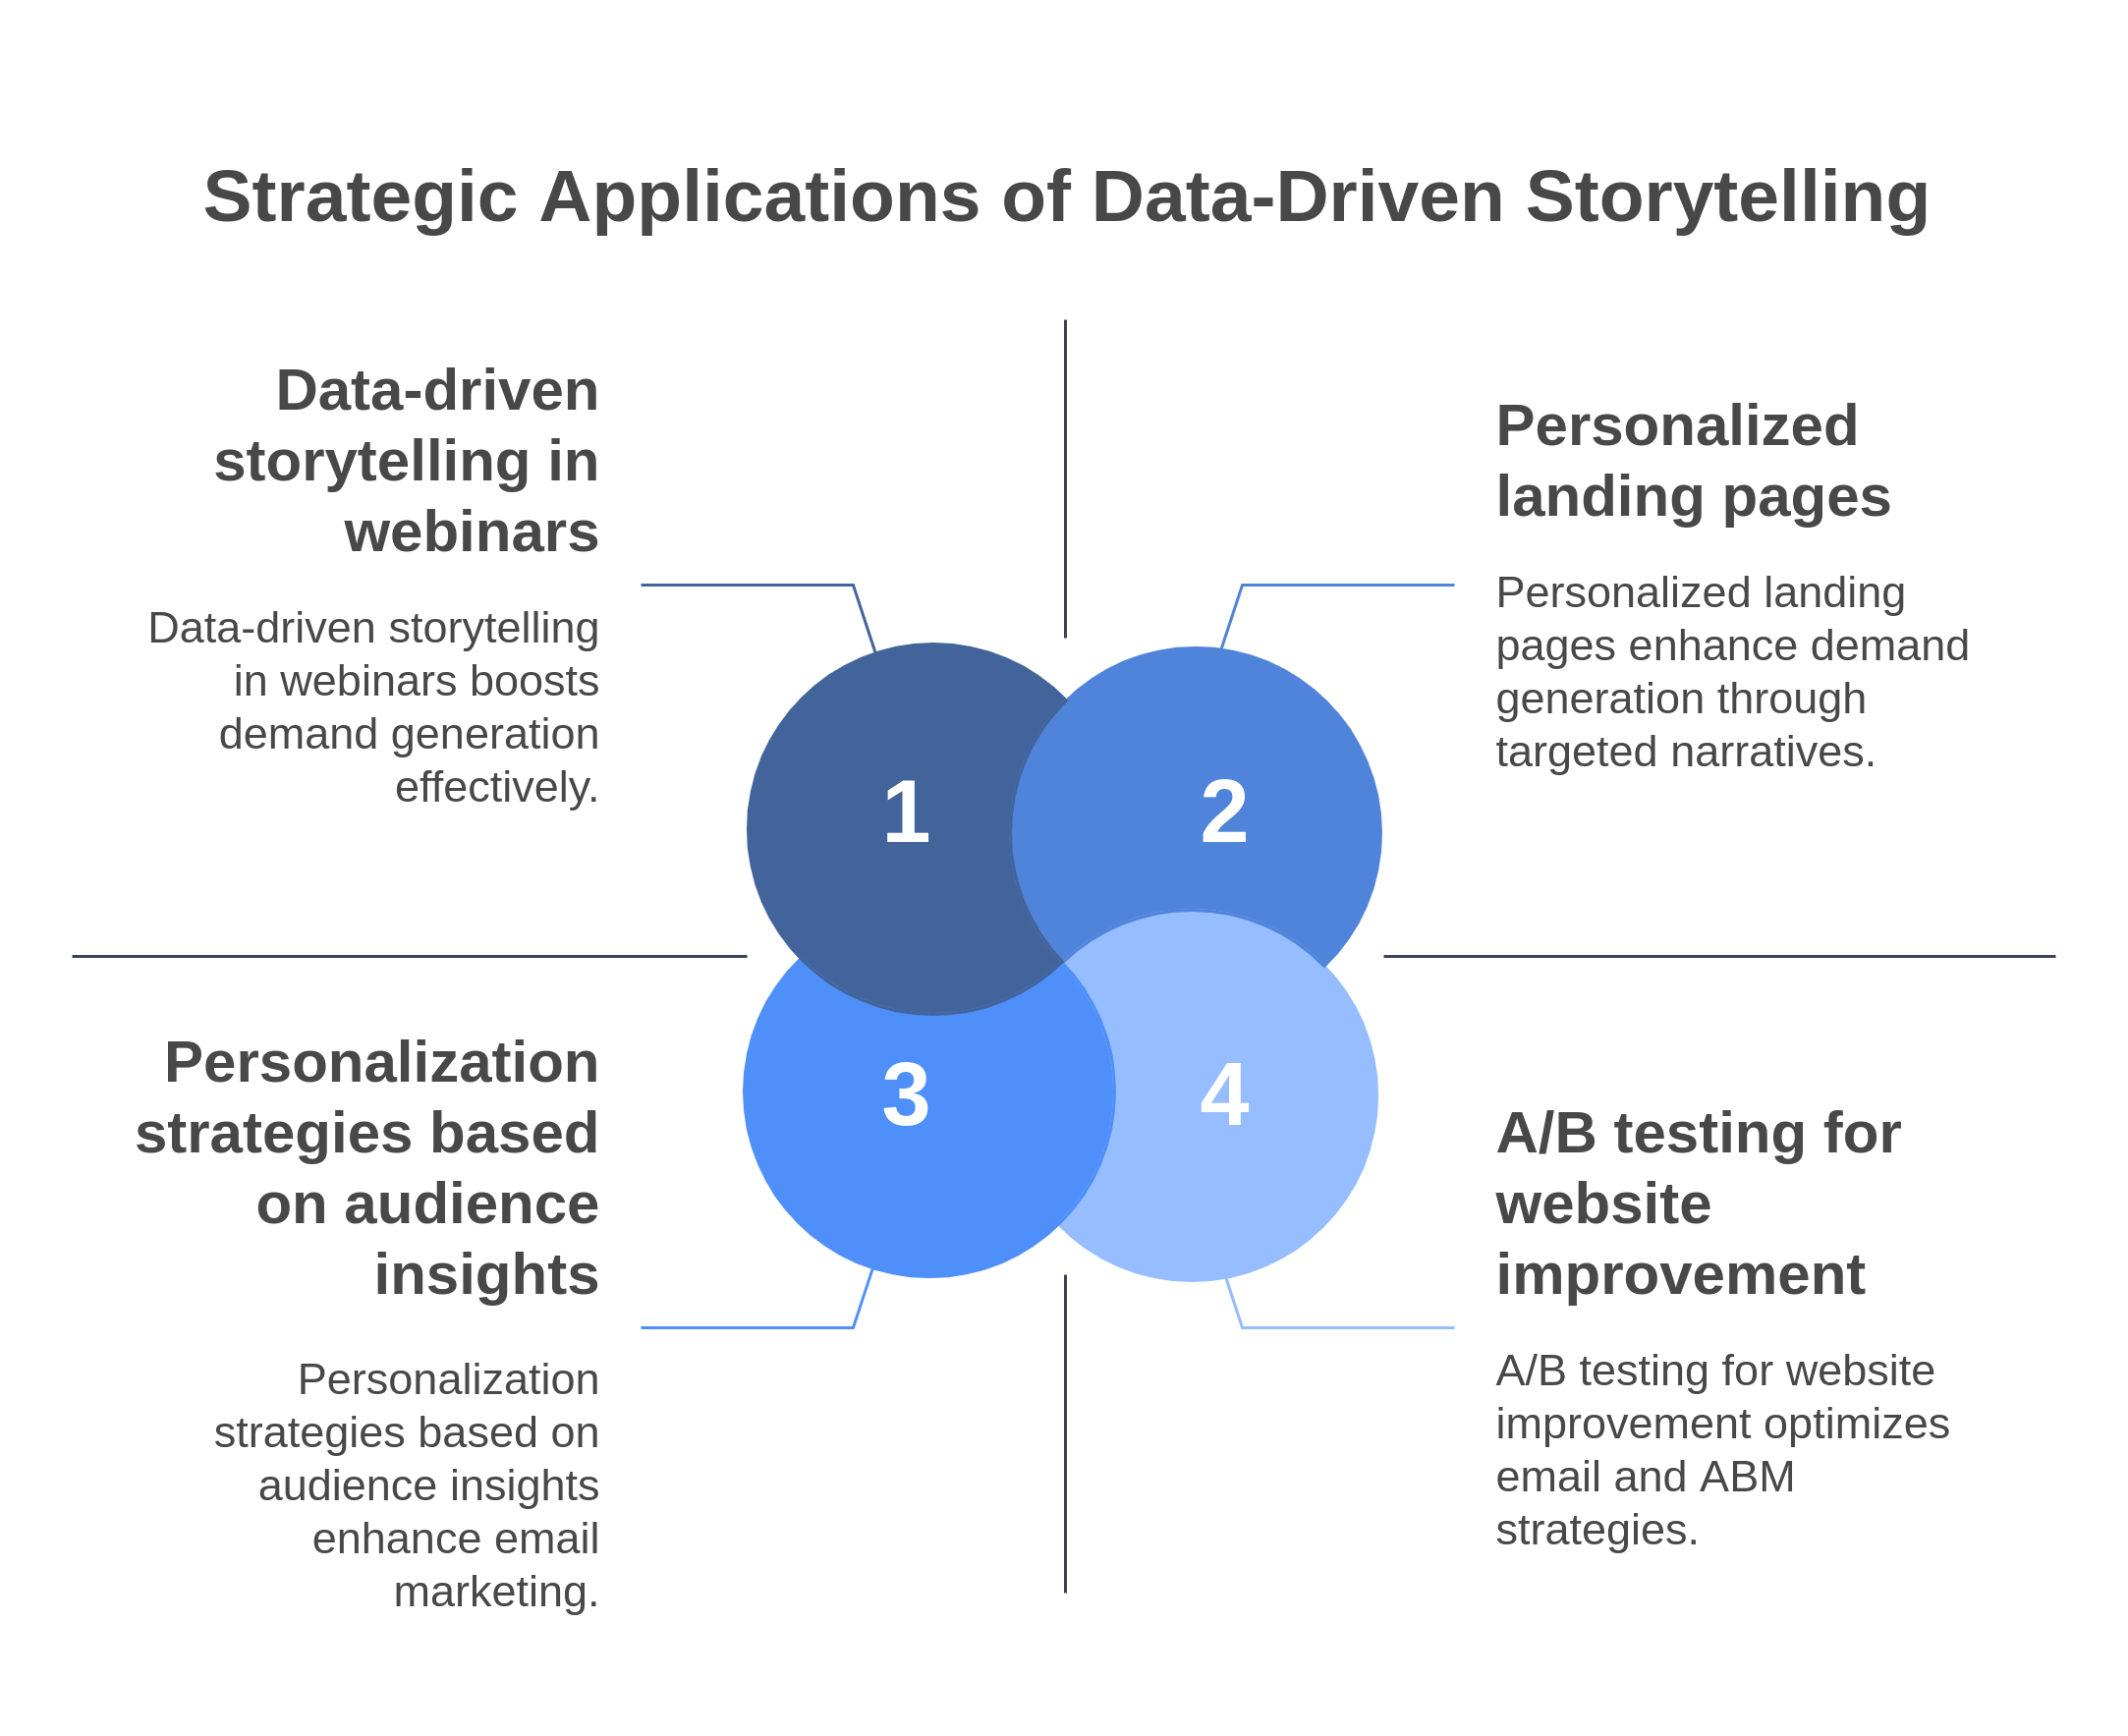
Data-driven storytelling isn't just about making content more engaging—it’s a strategic tool that can transform content marketing, email campaigns, demand generation, and website optimization. When used effectively, data helps build credibility, personalize experiences, and drive conversions across multiple marketing channels.
Using Data to Strengthen Content Marketing
In an era where attention spans are shrinking, content marketing must be insight-driven to stand out. Data-driven storytelling can make blog posts, whitepapers, reports, and social media content more authoritative, engaging, and actionable.
Blog Content: Blogs enriched with original research, proprietary data, and industry insights generate backlinks and higher search visibility. For example: HubSpot’s State of Marketing Report uses real-world statistics to support trends and predictions, making it a go-to resource for marketers.
Best practice: Use data-backed headlines (e.g., “How AI-Powered Personalization Increases B2B Conversions by 40%”) to immediately establish authority.
Whitepapers & Reports: Long-form content benefits the most from data-backed storytelling, helping businesses position themselves as thought leaders.
Best practice: Instead of dumping raw data, weave statistics into a cohesive story—present a challenge, showcase supporting data, and provide actionable takeaways.
Social Media Storytelling: Data makes social posts more shareable and credible. For example: Spotify Wrapped—while B2C—shows how businesses can use personalized data storytelling to create viral, shareable content.
Best practice: Use carousel posts on LinkedIn to break down complex insights into bite-sized takeaways (e.g., “5 Data-Backed Marketing Trends for 2025”).
Enhancing Email & Account-Based Marketing (ABM) with Data
- Personalization Strategies Based on Audience Insights
- Segmentation and personalization drive higher engagement rates in email marketing.
- Best practice: Use behavioral data to tailor messaging. Example: A B2B SaaS company sending industry-specific performance benchmarks to different customer segments.
Example: Drift’s email campaigns use real-time engagement data to send hyper-personalized messages based on user activity.
- Case Studies of Successful ABM Storytelling
- ABM thrives on tailored storytelling using firmographic and behavioral data.
- Example: A cybersecurity SaaS company targeting CIOs can create a data-backed security report that speaks to the unique concerns of that audience.
Best practice: Use data-driven case studies to show how businesses in the same industry achieved success (e.g., “How Company X Reduced Churn by 35% with Predictive Analytics”).
- Personalization Strategies Based on Audience Insights
Boosting Demand Generation and Lead Nurturing
Data-Driven Storytelling in Gated Content & Lead Magnets
- Gated content (eBooks, industry reports) should offer proprietary data to establish exclusivity.
Best practice: Position your data-backed content as “insider insights” (e.g., “Exclusive Report: AI’s Role in B2B Personalization—What 500 Marketers Revealed”).
How to Use Storytelling in Webinars & Thought Leadership Content
- Webinars should highlight key data points to validate insights.
- Example: A fintech company hosting a webinar on “The Future of Digital Payments” should use industry benchmarks to showcase adoption trends.
Best practice: Turn webinar discussions into bite-sized LinkedIn posts featuring key stats and takeaways.
Optimizing Website & Landing Pages with Data Insights
Using Heatmaps, A/B Testing & Analytics to Improve Storytelling
- Heatmaps and session recordings help identify where users drop off and what content resonates.
Best practice: Use scroll-depth analytics to optimize CTA placement and ensure high-impact data points appear above the fold.
Personalizing Landing Pages with Data-Driven Narratives
- Dynamic landing pages should serve different headlines, testimonials, and content blocks based on visitor data.
- Example: Fragmatic can help B2B marketers create personalizedlandingpageexperiences by dynamically adjusting content based on visitor industry, company size, or past interactions.
- Best practice: A/B test data-driven headlines versus traditional messaging to see which drives higher engagement.
Measuring the Success of Data-Driven Storytelling
Data-driven storytelling isn’t just about crafting compelling narratives—it’s about ensuring those narratives drive real business impact. Measuring success requires tracking key metrics and continuously refining storytelling approaches based on insights.
Key Metrics to Track
To determine whether data-driven storytelling is resonating with your audience, these quantifiable metrics offer clarity:
1. Engagement Rates
- Measures how interactive and compelling your content is.
- Includes metrics like scroll depth, dwell time, and social shares.
- Example: A B2B whitepaper with embedded interactive charts may see higher engagement than static PDFs.
2. Time on Page
- If visitors stay longer, it suggests the content is captivating and valuable.
- Best practice: Compare time on page across content types—long-form reports vs. blog posts—to see what storytelling format retains attention best.
3. Click-Through Rate (CTR)
- Shows how effective headlines, visuals, and CTAs are at driving action.
- Best practice: A/B test different storytelling angles in email subject lines and ad copy to find the most compelling narrative.
4. Lead Generation & Conversions
- The ultimate goal of data-driven storytelling is influencing buying decisions.
- Metrics to track: Form submissions, gated content downloads, demo requests, and pipeline attribution.
Example: A personalization software company measuring how a data-backed case study contributes to inbound demo requests.
How to Continuously Improve Your Storytelling Approach
Even the most compelling stories need optimization. By analyzing performance data, brands can refine messaging, formats, and distribution strategies.
1. Using A/B Testing to Refine Messaging
- A/B testing reveals which storytelling techniques resonate most.
- Example: Testing a data-backed blog headline (e.g., “How AI-Powered Personalization Boosts B2B Conversions by 40%” vs. “The Future of AI in B2B Marketing”) to see which drives more clicks.
- Best practice: Experiment with statistical storytelling (e.g., emphasizing benchmark stats vs. using customer success stories) in email subject lines.
2. Learning from Data Trends to Iterate Storytelling Tactics
- Analyzing past content performance can reveal emerging trends that inform future storytelling.
- Example: If video-based data storytelling consistently outperforms static reports, investing in motion-infused infographics might be the next move.
- Best practice: Use predictive analytics to anticipate what topics and formats will gain traction based on historical engagement.
Brands Winning with Data-Driven Storytelling
The most successful brands don’t just use data—they transform it into engaging, high-impact stories that resonate with their audience. From personalized campaigns to industry reports, these companies exemplify how data-driven storytelling fuels engagement, trust, and conversions.
LinkedIn – Using Data to Tell Industry-Specific Stories
LinkedIn has mastered the art of data-driven thought leadership, leveraging insights from its vast professional network to create highly relevant, industry-specific reports.
One standout example is the B2B Marketing Benchmark Report, which uses platform-wide data to highlight trends in engagement, content formats, and ad performance.
By sharing original insights backed by data, LinkedIn positions itself as an authority in B2B marketing while providing actionable takeaways for brands.
What B2B Marketers Can Learn:
Turn platform data into valuable industry insights. If your business has access to user trends, anonymized data, or benchmarks, consider repurposing them into content that educates your audience.
Use interactive formats. LinkedIn integrates visual storytelling elements like infographics and animated charts to make complex data easier to digest.
Spotify – Wrapped Campaign & Personalized Data Stories
Spotify’s Wrapped campaign is a gold standard in personalized data storytelling, turning user listening habits into sharable, social-first content.
Every year, Spotify aggregates user data—from most-played songs to total minutes listened—into visually engaging, interactive stories.
Users feel personally connected to the content, making it one of the most anticipated digital marketing campaigns globally.
What B2B Marketers Can Learn:
Leverage personalization at scale. While B2B brands may not have user playlists, they can use customer behavior data to deliver tailored insights (e.g., personalized reports based on industry benchmarks).
Encourage user-generated content. Spotify Wrapped succeeds because users want to share their data story—B2B brands can replicate this by offering interactive reports or engagement-based achievements (e.g., “Your Year in Content Marketing Performance”).
HubSpot – Data-Powered Reports & Visual Storytelling
HubSpot has built its brand around data-driven inbound marketing, using its extensive customer and market data to create authoritative industry reports.
One of its flagship content pieces is the State of Marketing Report, packed with insights from real-world marketing campaigns, survey data, and performance trends.
HubSpot uses a blend of data visualization, storytelling, and practical takeaways to make their insights both digestible and actionable.
What B2B Marketers Can Learn:
Use data to build authority. HubSpot’s research-driven content isn’t just engaging—it positions the brand as a go-to resource for B2B marketing trends.
Make data actionable. Instead of just presenting stats, HubSpot integrates real-world applications, showing how marketers can implement the findings in their own strategies.
Google – Data-Led Thought Leadership
Google’s Think with Google platform is a masterclass in data-driven thought leadership, using search trends, consumer insights, and behavioral data to shape marketing strategies.
Google frequently publishes deep dives into market shifts, showing how search behavior reflects changes in consumer demand and industry trends.
They use interactive data visualizations to make complex information engaging and accessible to marketers, agencies, and brands.
What B2B Marketers Can Learn:
- Turn search and behavioral data into insights. Even if you don’t have access to global search trends, your own website analytics, CRM data, and engagement metrics can reveal valuable storytelling opportunities.
- Use real-world applications. Google ensures its data stories are always linked to practical marketing takeaways, helping B2B brands make informed, data-backed decisions.
Conclusion
B2B marketing is no longer just about logic, facts, and product features—it’s about telling compelling, data-driven stories that make an impact. The brands leading the way are those that turn data into narratives that educate, inspire, and drive action. Data-driven storytelling enhances engagement, credibility, and decision-making by transforming raw information into memorable, persuasive narratives that resonate with B2B buyers. As buyer expectations evolve, B2B brands must move beyond traditional marketing tactics and embrace strategies that are personalized, insight-driven, and impact-focused. Buyers expect content that speaks directly to their needs, challenges, and goals. Marketers who leverage data effectively will build stronger credibility, while those who use storytelling to simplify complexity and showcase value will win trust and drive conversions. In 2025, data-driven storytelling won’t be an option—it will be the foundation of effective B2B marketing.
To get started, brands should audit their existing content to identify where data can enhance storytelling. Leveraging first-party data from website analytics, CRM insights, and customer trends can help create stories based on real behaviors and pain points. Investing in data visualization tools like infographics, dashboards, and interactive content will make insights more engaging and accessible. Finally, experimentation and refinement will be key—testing different storytelling formats, tracking engagement metrics, and optimizing based on data-driven insights will ensure continuous improvement. B2B marketers who master data-driven storytelling won’t just capture attention—they’ll create lasting impact. Now is the time to turn data into stories that drive action.